270: Exploring the Kelvin UI for Platform Administrators
This course is for Platform Administrators who are new to the Kelvin UI and want a clear picture of what tools are available to them.
By the end, you will know every section of the Administration area, understand what you can do in each one, and be ready to explore the full documentation for any area you need to go deeper on.
Where this course fits
This is the introductory course for the Platform Administrator path. It sits before the hands-on setup courses.
- This course — what the Administration area contains and what each section does
- 271: Setting Up Platform Infrastructure — clusters, nodes, and user setup
- 272: Setting Up Assets and Data Streams Quickly — bulk asset and data stream creation
Note
This course does not walk through every step of every feature. The goal is awareness. Once you know what exists, the detailed how-to guides in the documentation will make much more sense.
The Administration Area at a Glance
When you log in to Kelvin with Platform Administrator credentials, you will see two main sections in the left sidebar: Operations and Administration.
Operations is where your Engineering team works. Administration is yours.
The Administration area gives you control over nine distinct areas of the platform.
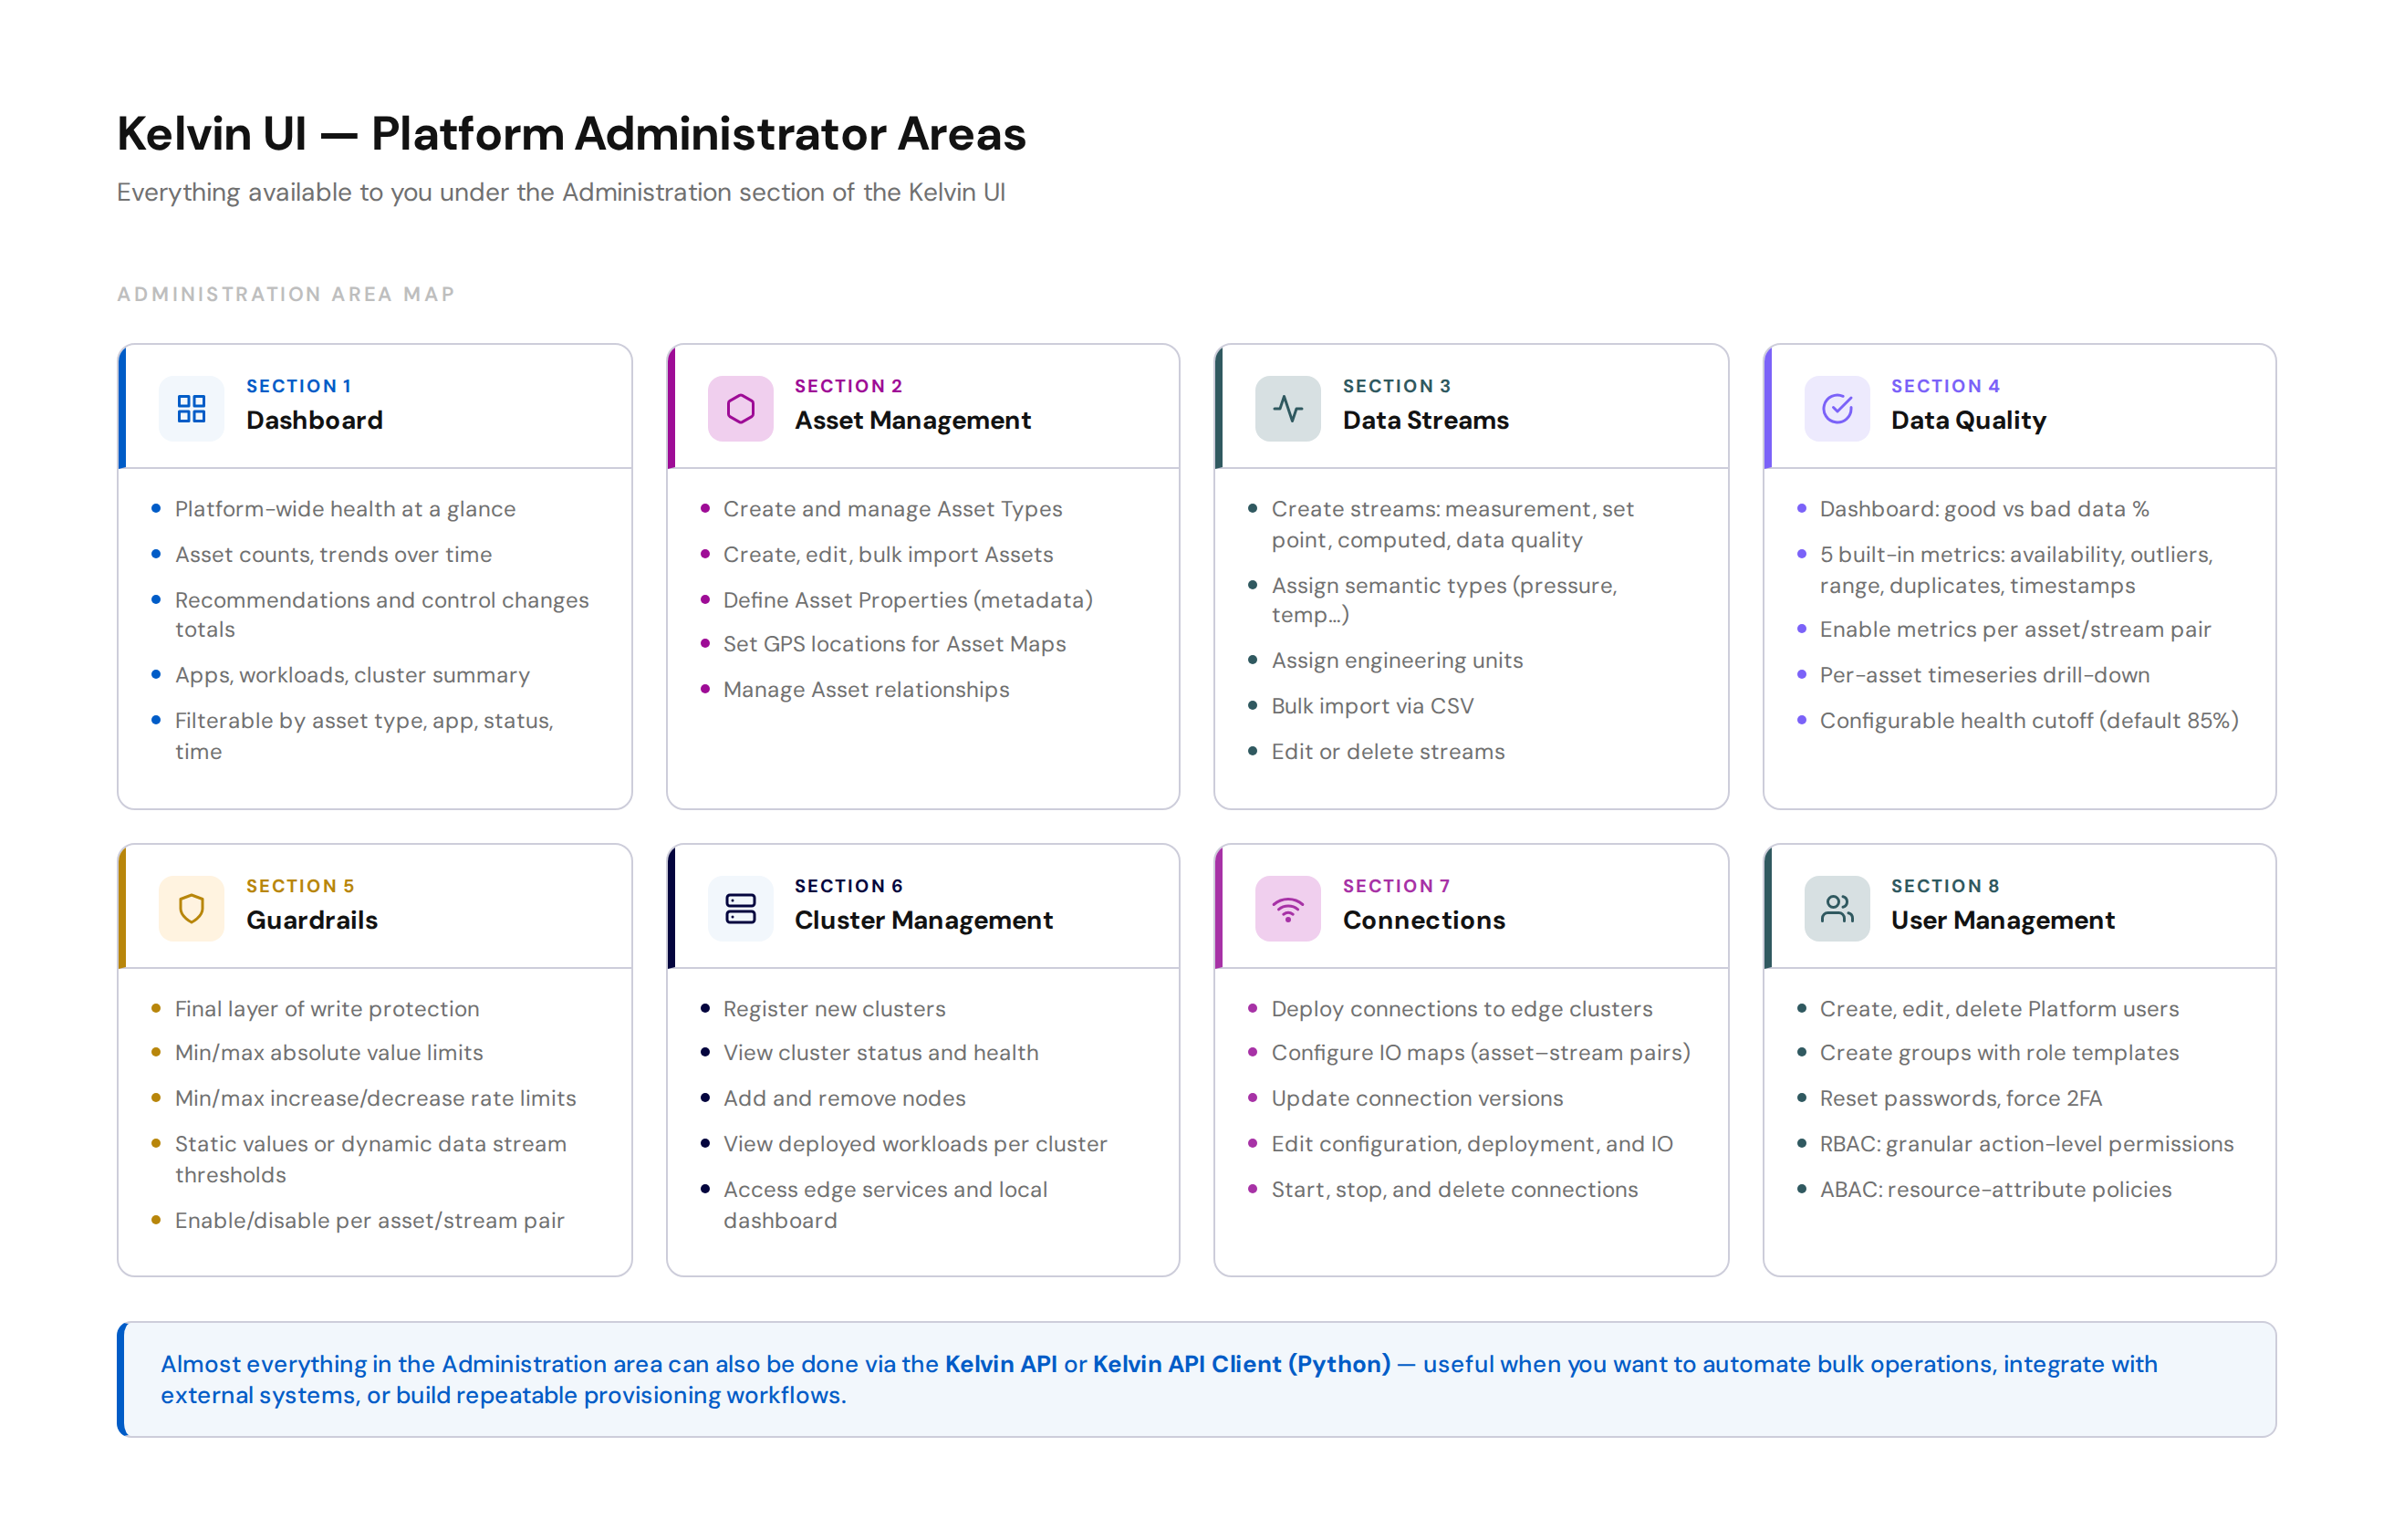
Pro Tip
Almost everything in the Administration area can also be done through the Kelvin API or the Kelvin API Client (Python). If you need to automate setup, build repeatable provisioning scripts, or integrate Kelvin into an existing IT workflow, the API is the right tool. The UI is best for day-to-day management.
Section 1: Dashboard
The Administration Dashboard is the first thing you see when you enter the Administration area. It gives you a platform-wide health snapshot without having to dig into individual pages.
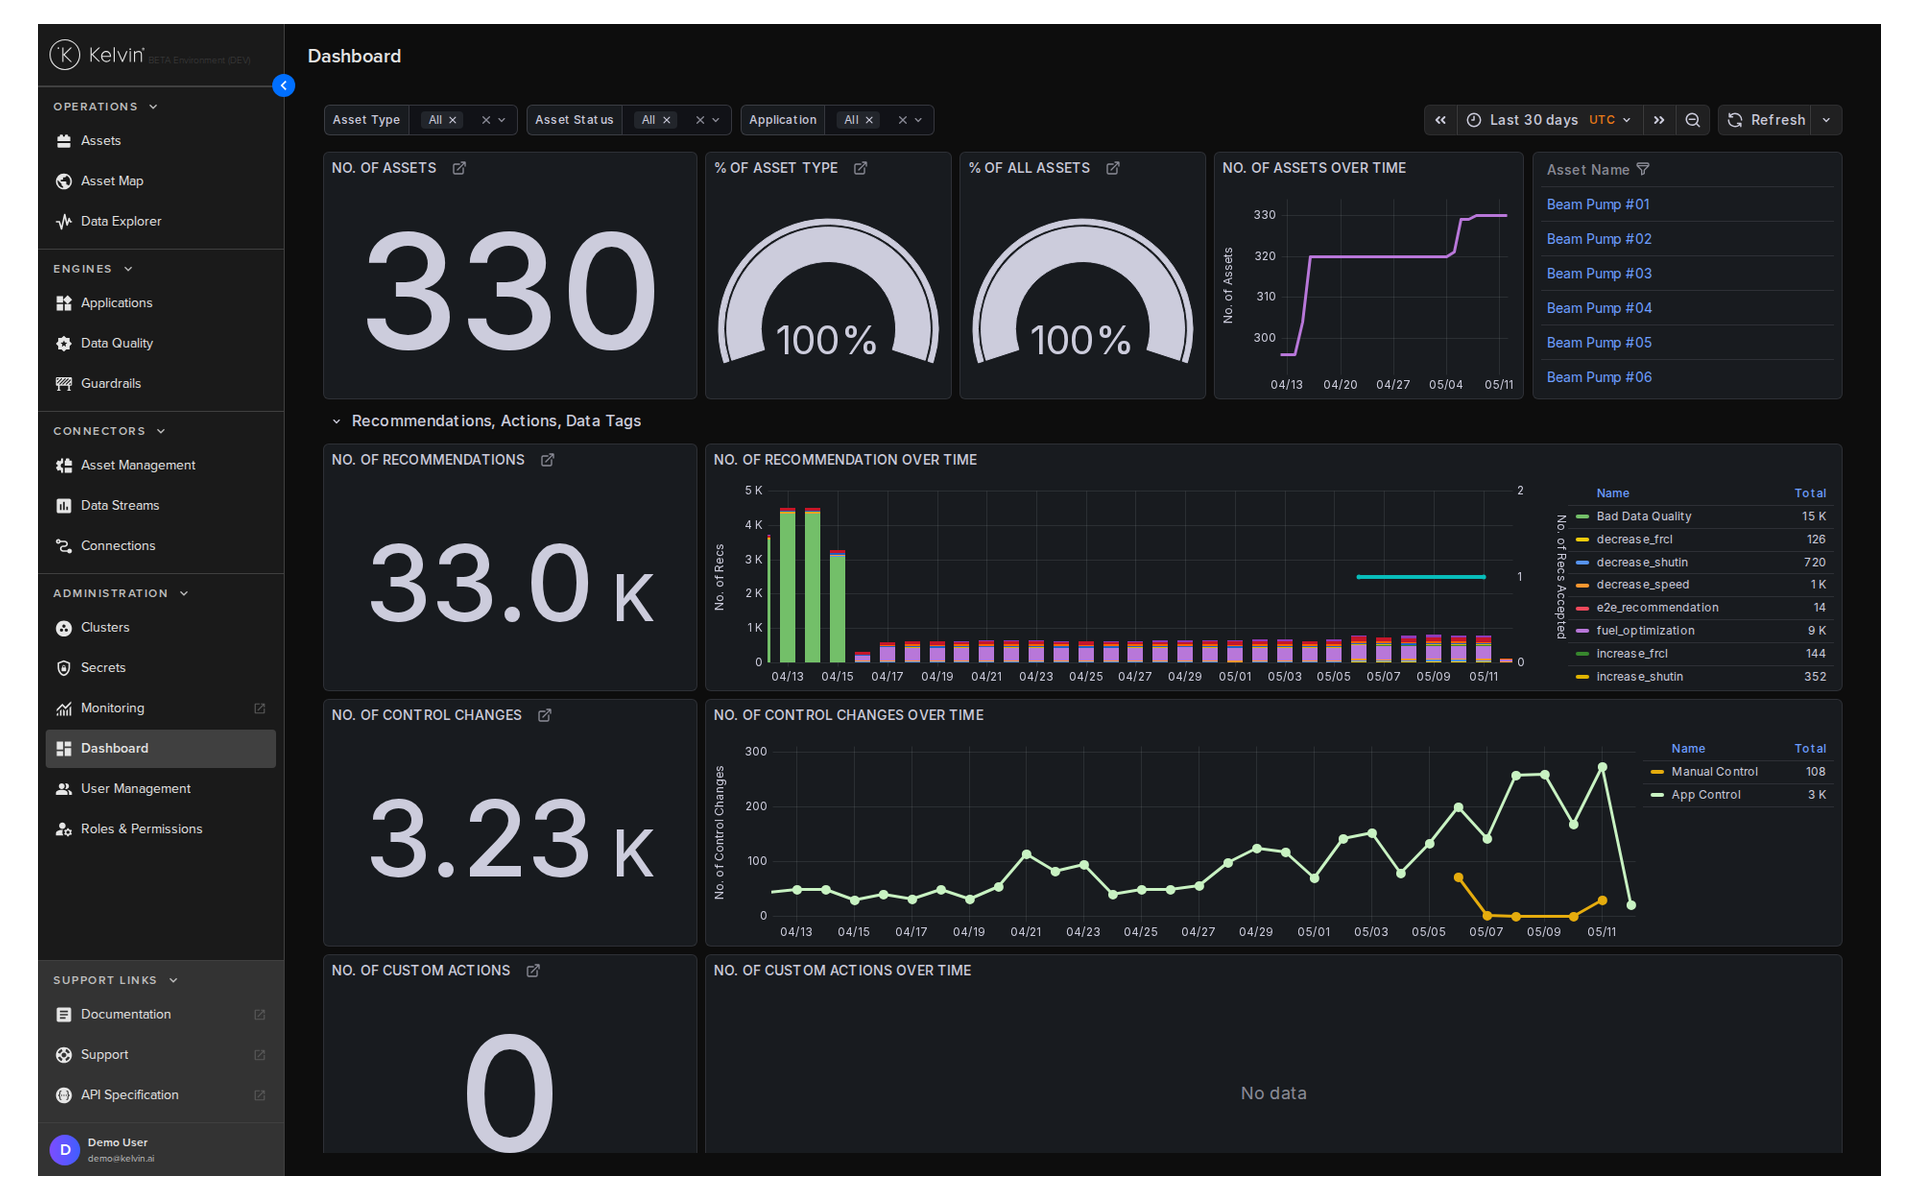
The dashboard is fixed — you cannot customise its layout — but you can filter it to focus on what matters to you.
Filters available:
| Filter | What it does |
|---|---|
| Time range | Limits statistics to a specific window |
| Asset Types | Shows data only for selected asset types |
| Applications | Shows data only for selected applications |
| Asset Status | Shows only assets matching a chosen status |
When you apply multiple filters together, the platform shows only statistics that meet all the selected criteria.
What the dashboard shows:
The statistics are grouped into four themes.
| Theme | Examples of what you see |
|---|---|
| Assets | Total asset count, % by asset type, asset count over time |
| Recommendations, Actions, Data Tags | Total recommendations, control change counts, data tag trends |
| Apps | Number of apps, top 5 by deployments, workload counts |
| Orchestration | Cluster count, Kelvin version distribution, data stream totals |
Use the dashboard to spot trends: a sudden drop in active assets, an unusual spike in control changes, or a cluster running an old version.
For full documentation, visit:
Section 2: Asset Management
Assets are the industrial equipment your platform monitors and controls. Before Operations Engineers can do anything with an asset in the Kelvin UI, you need to create it here.
The asset model has a clear hierarchy. Understanding it before you start prevents most setup errors.
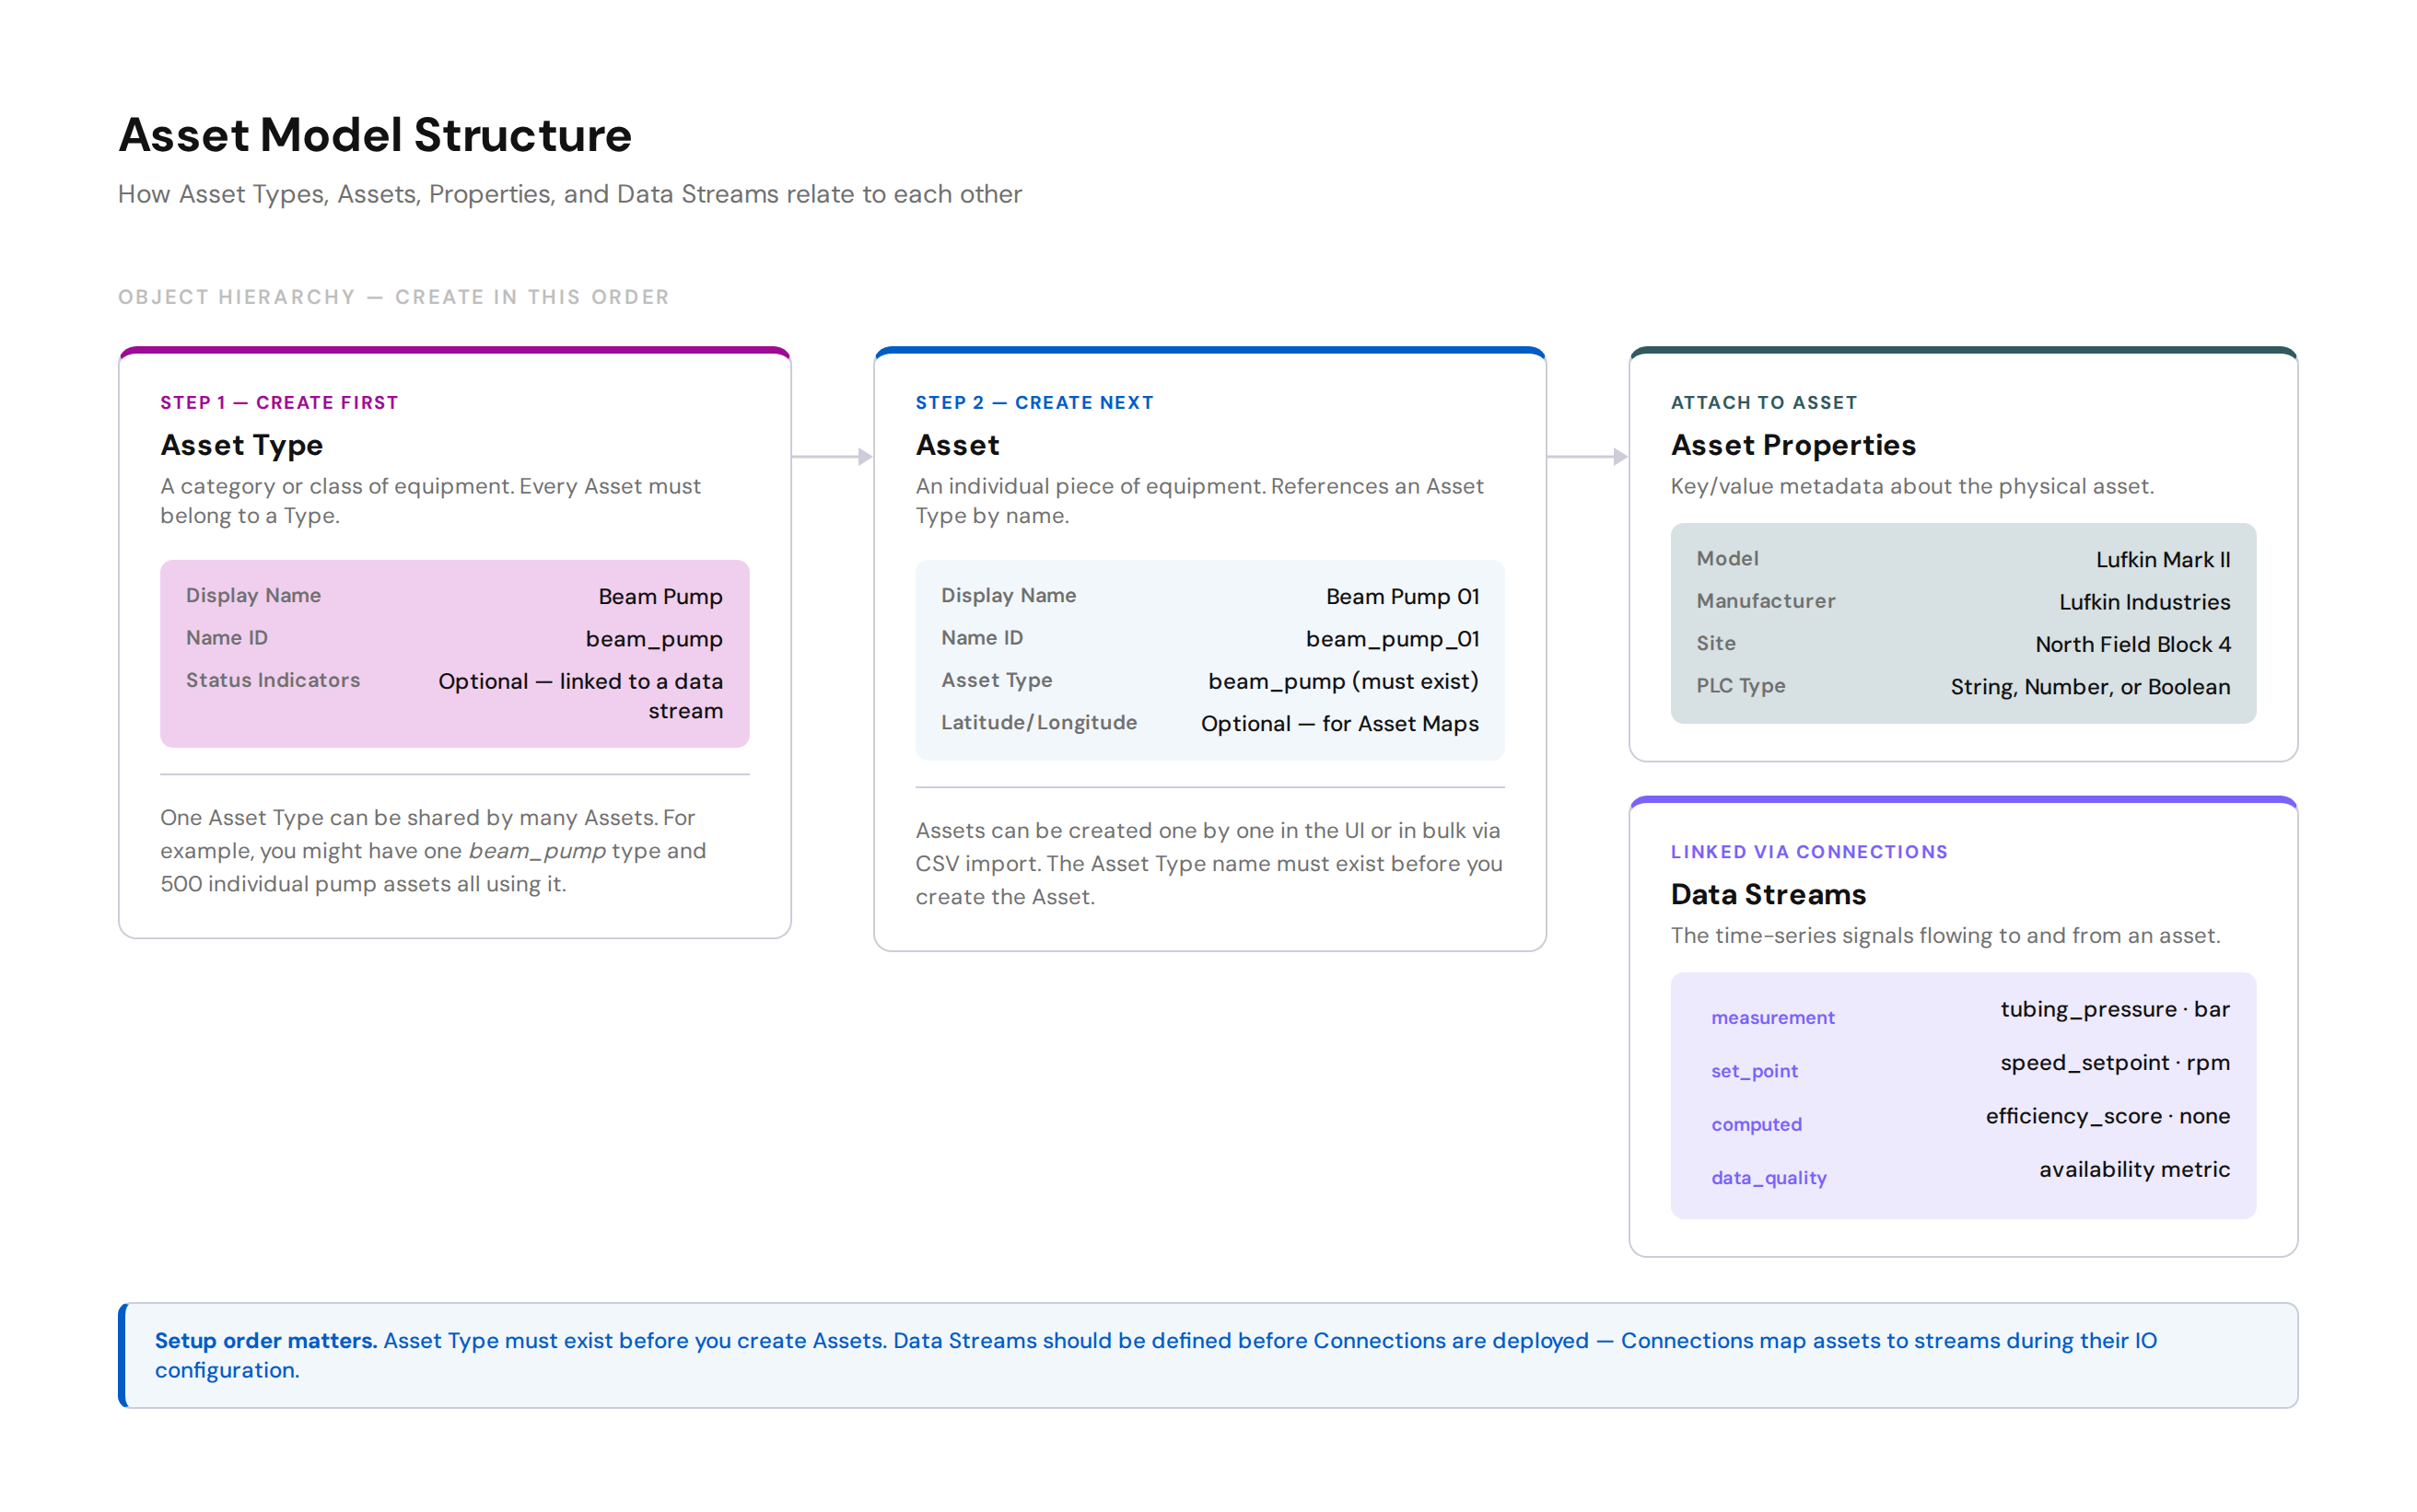
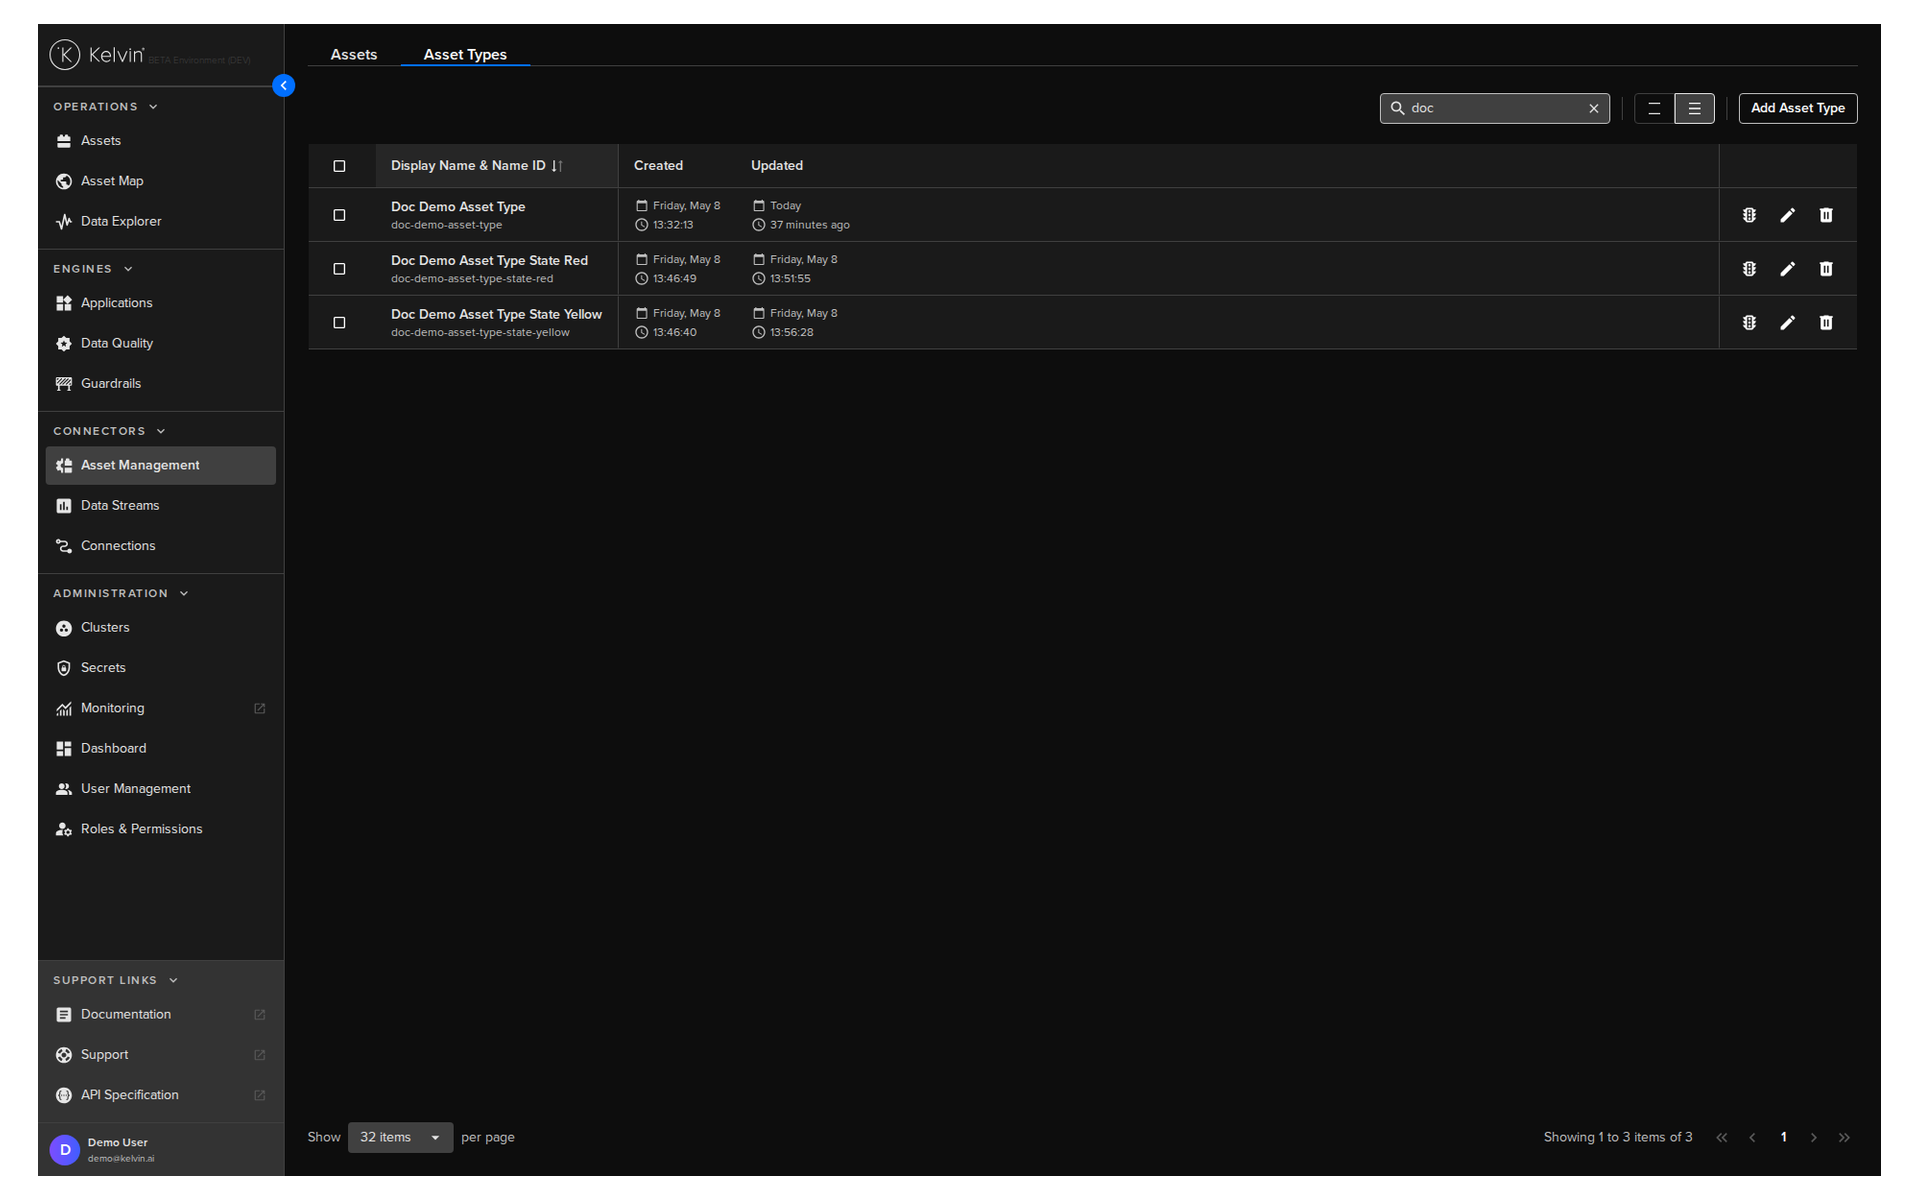
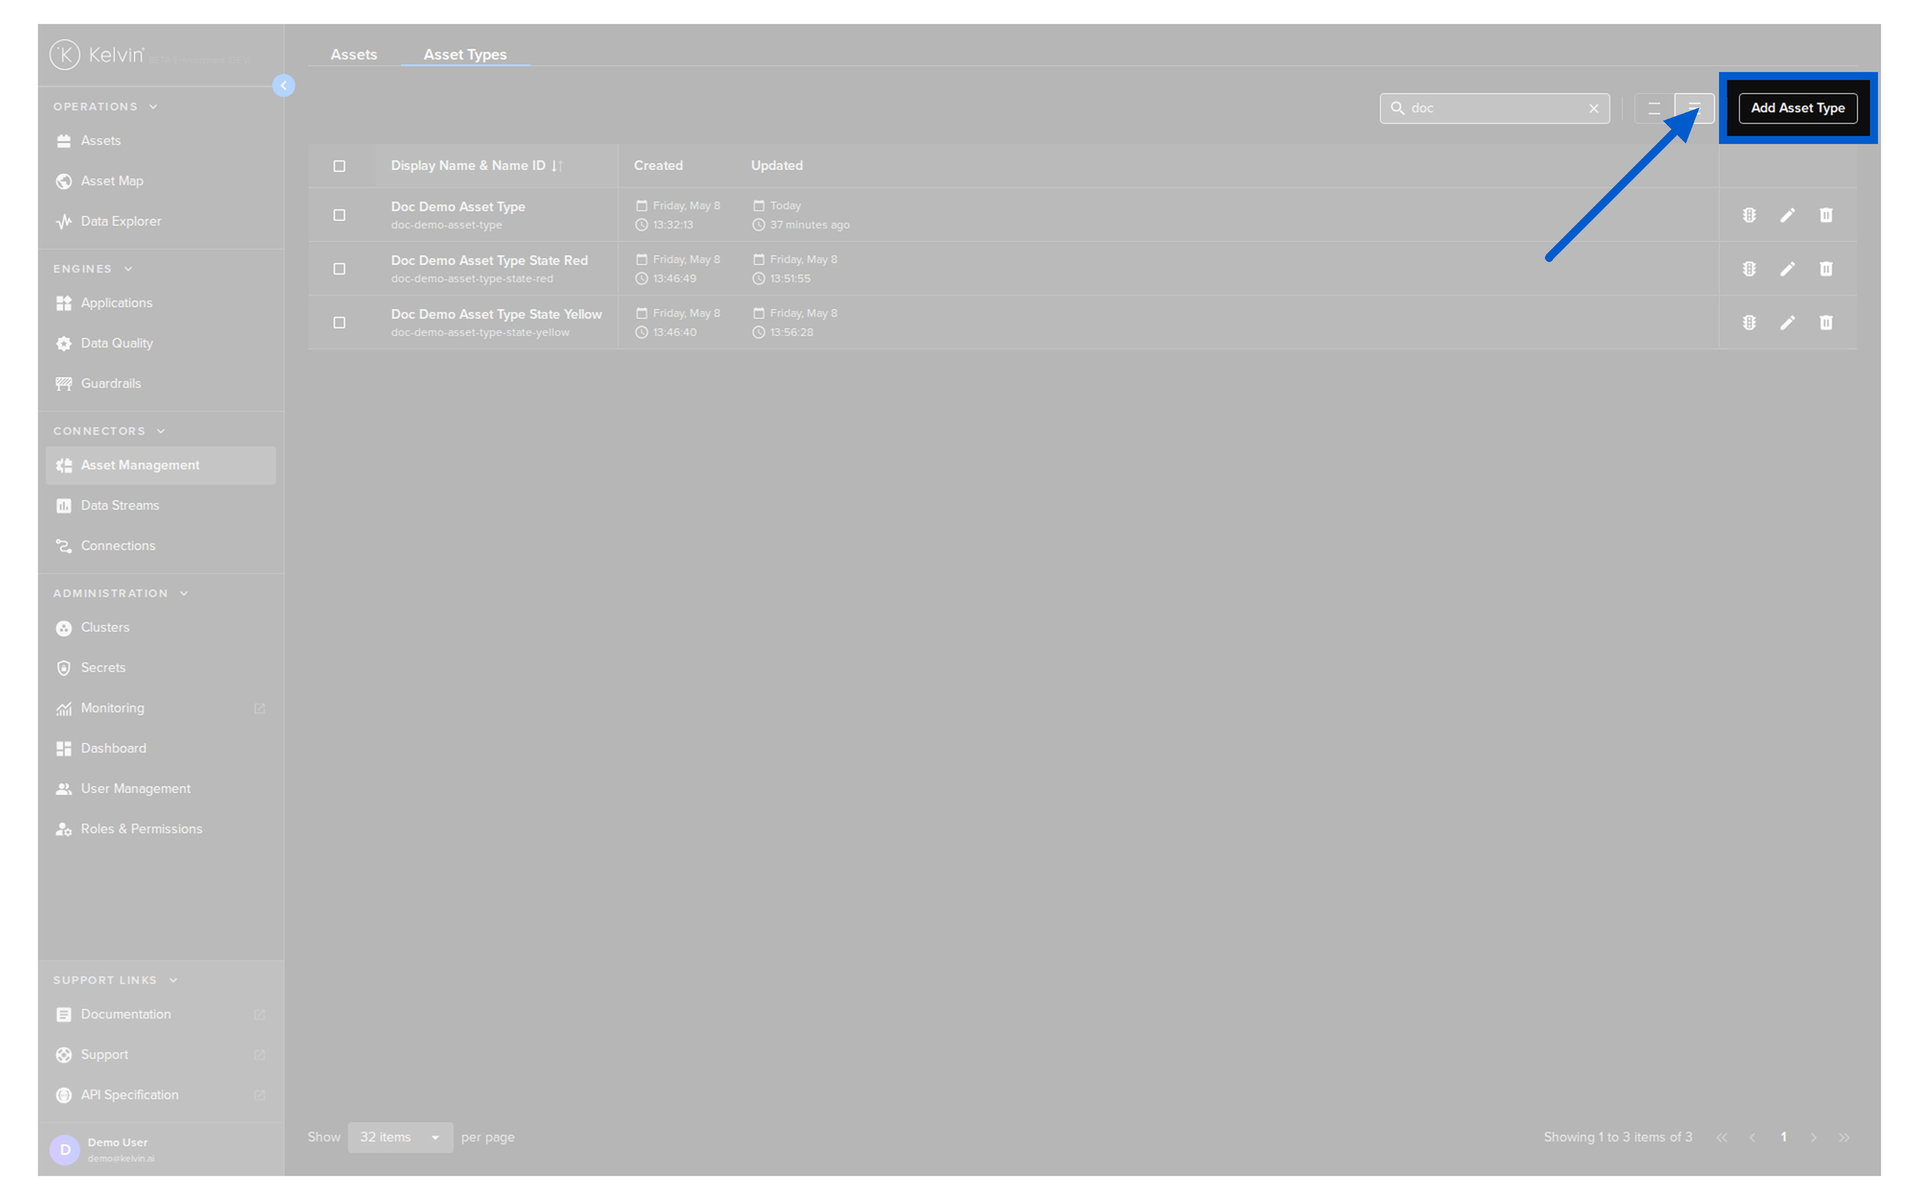
Asset Types
An Asset Type is a category of equipment. Every asset must belong to a type. You create types first.
Examples: beam_pump, gas_compressor, wind_turbine.
From the Administration area you can:
- Create and edit Asset Types
- Optionally configure Status Indicators — rules that change a visual indicator on the asset based on live data stream values
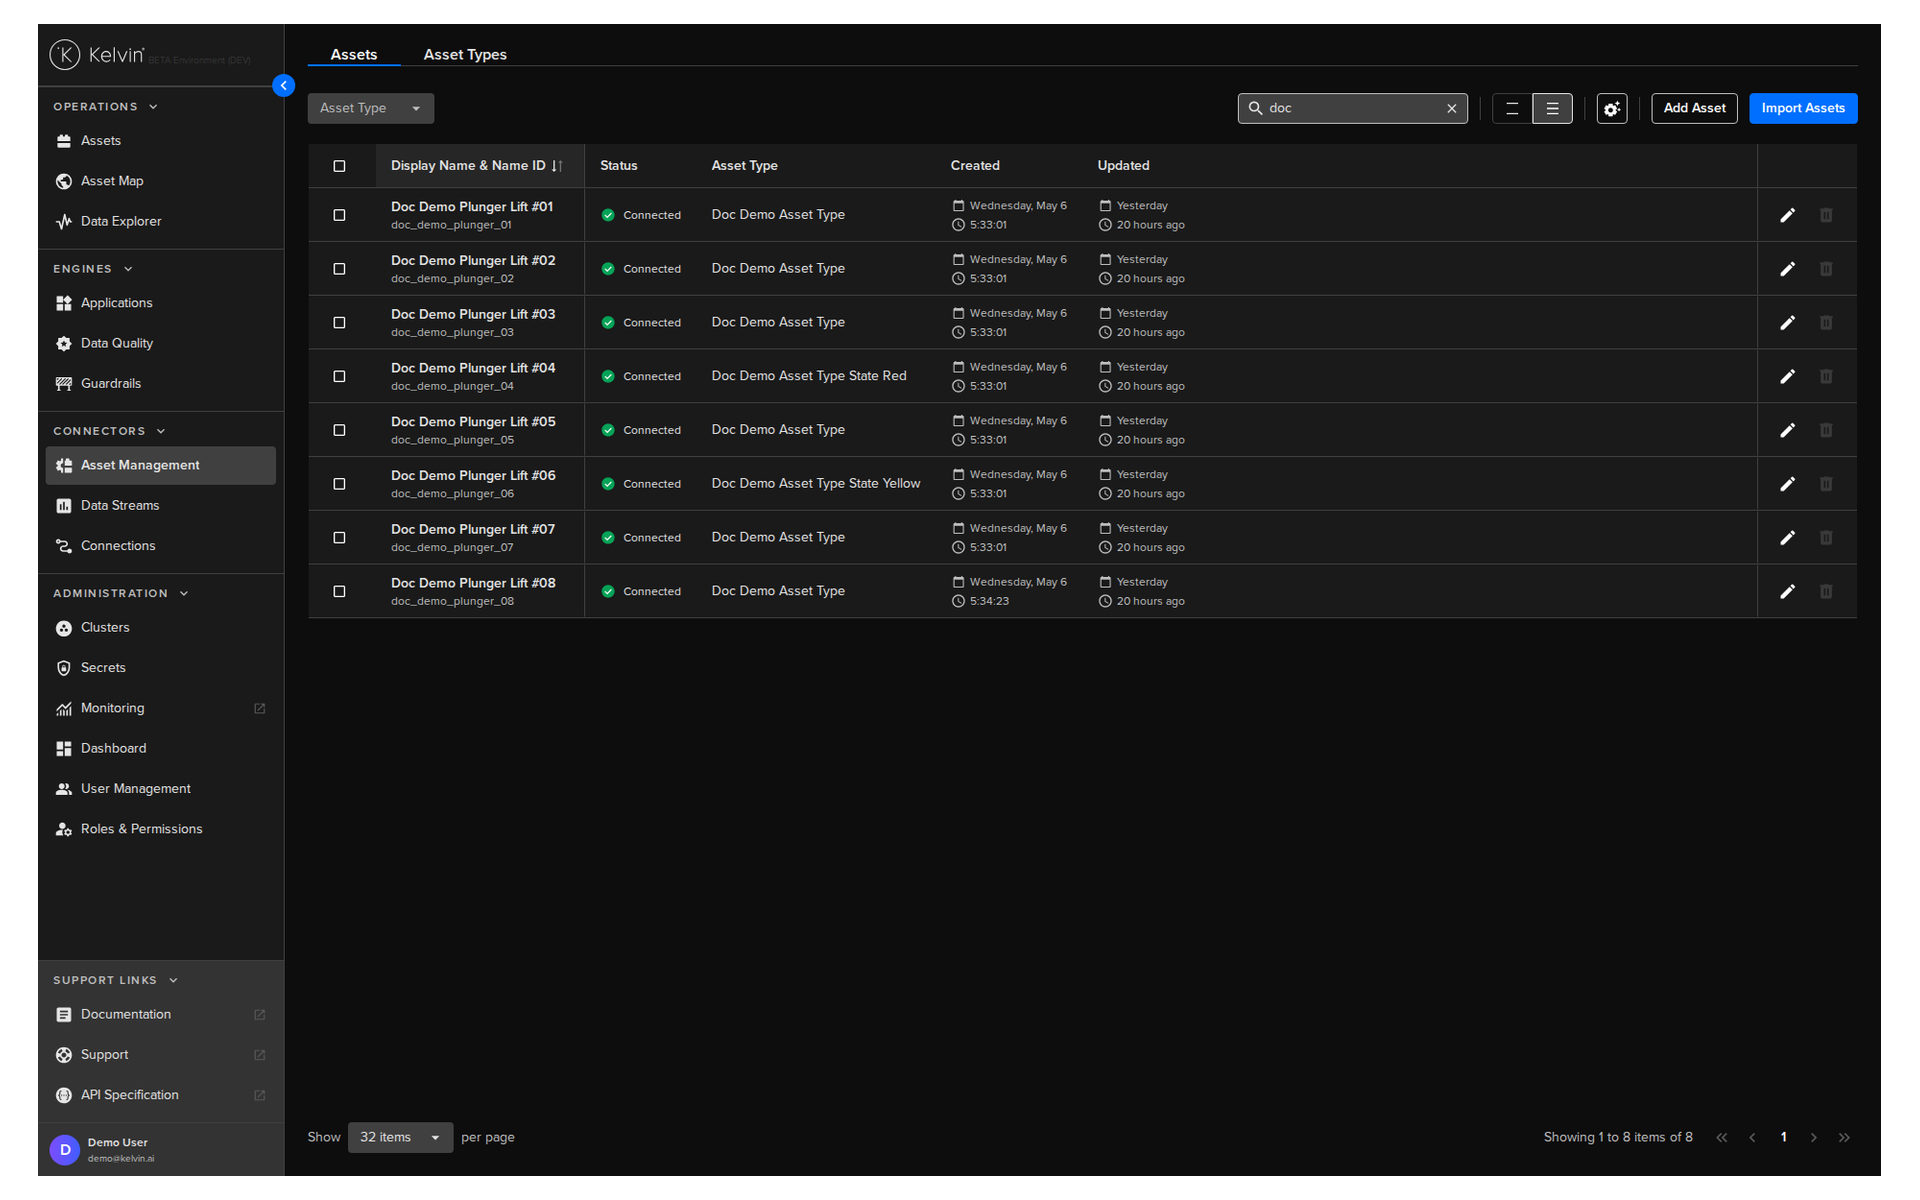
Assets
An Asset is an individual piece of equipment. It references an Asset Type, has a display name and a Name ID, and can hold optional metadata.
From the Administration area you can:
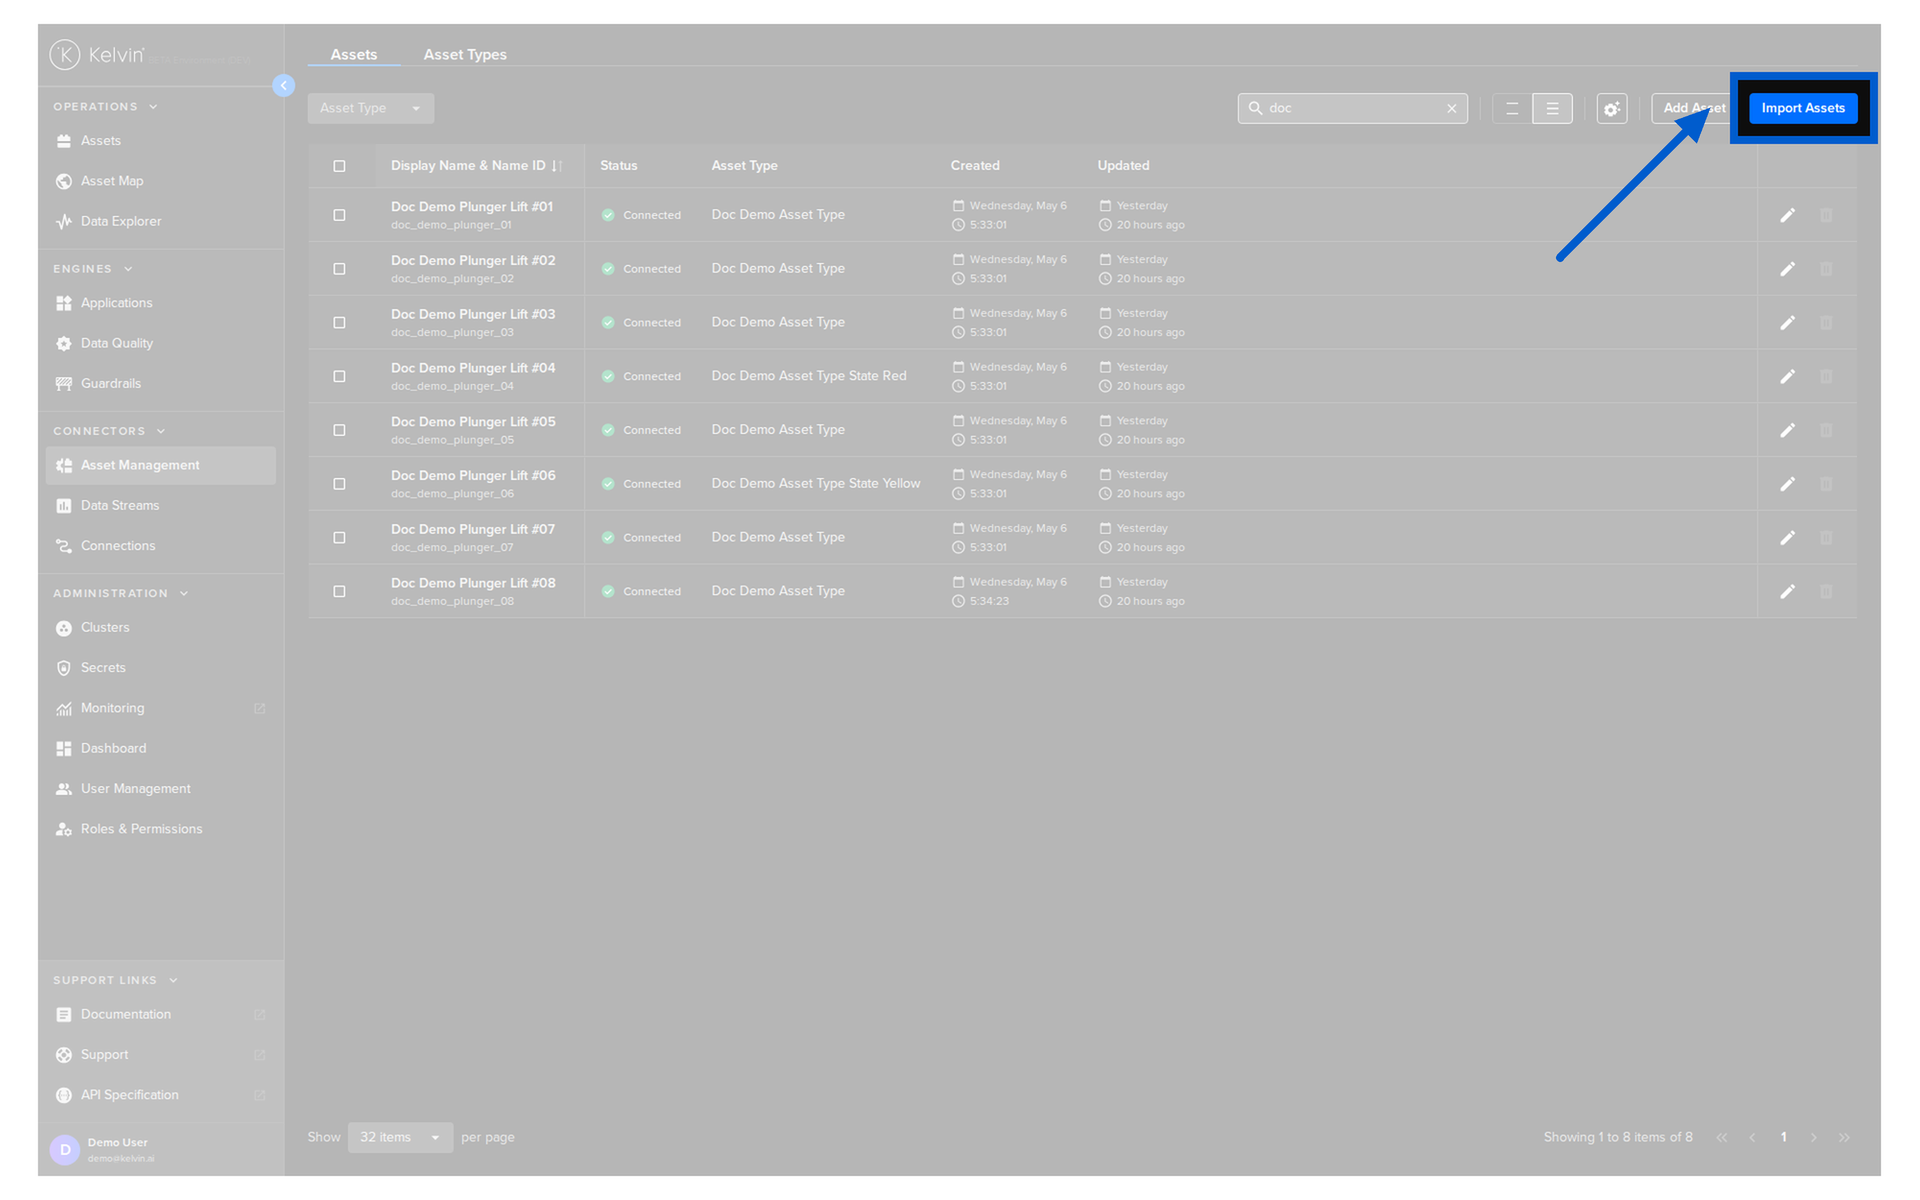
- Create assets one by one
- Bulk import many assets at once via CSV — the fastest path for large rollouts
- Edit and delete assets
Optional fields when creating an asset:
| Field | What it enables |
|---|---|
| Latitude / Longitude | Pins the asset on the Asset Maps view |
| Relationships | Shows links between assets in Asset Maps |
| Cluster | Pre-assigns the asset's default cluster |
Asset Properties
Custom Properties
Asset Properties are custom key/value metadata you attach to an asset. They describe the physical characteristics of the equipment.
Properties are freeform — you define the keys and values that make sense for your operation. Common examples: Model, Manufacturer, Serial Number, Site, PLC Type.
Properties can be read by SmartApps, which allows programs to behave differently depending on the asset's attributes.
Note
Properties are typed: Number, String, or Boolean. Once a type is set, it cannot be changed. If you need a different type for the same key, you must create a new property.
Location Properties
latitude and longitude properties are reserved property names.
THey can be set on each asset and set where the asset will appear on the Asset Maps view, giving Operations Engineers a geographic overview of the fleet. This is set when creating or editing an asset.
For full documentation, visit:
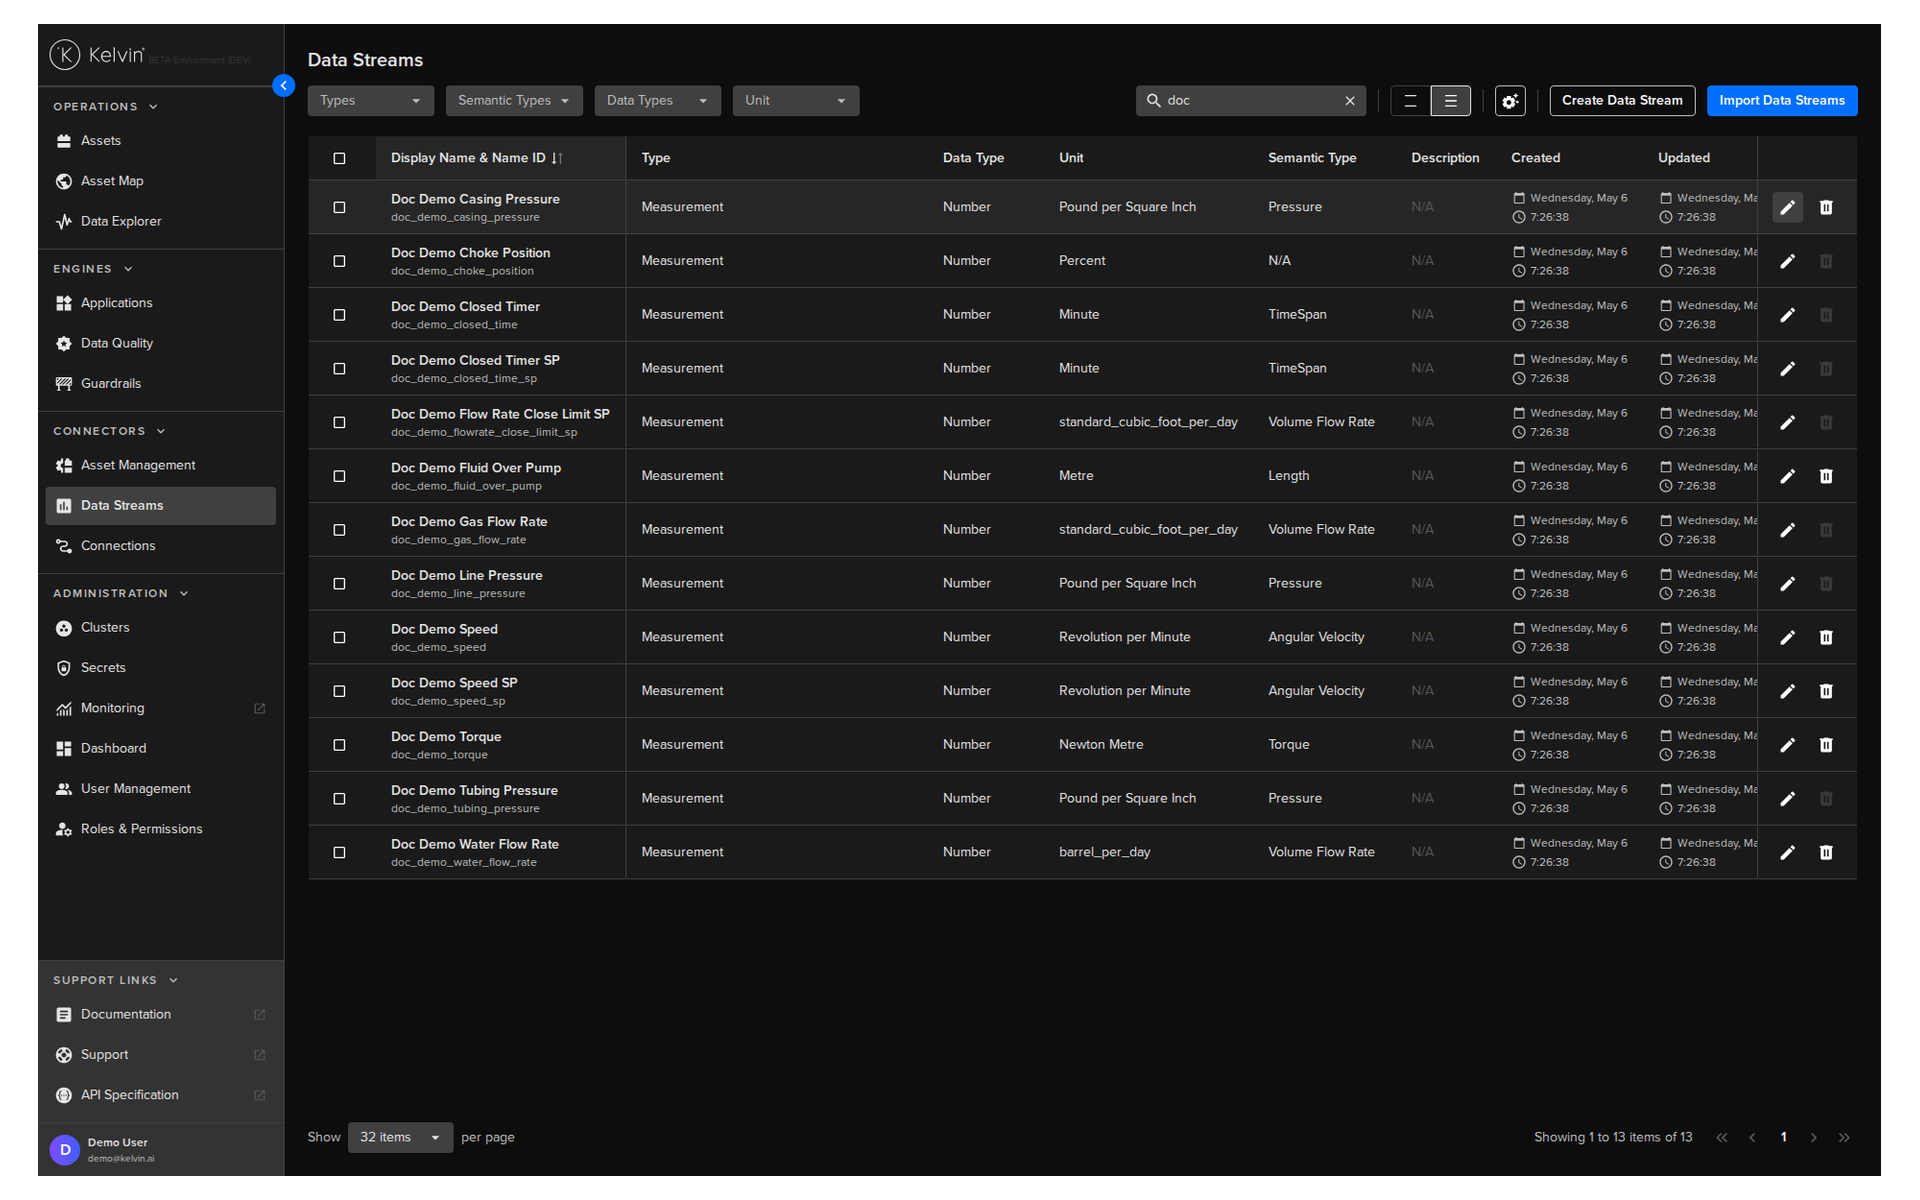
Section 3: Data Streams
A Data Stream is a named signal associated with an asset. It represents one channel of data — a measurement coming in from a sensor, a set point being sent out to a controller, or a computed value from a SmartApp.
You define data streams in Administration. Connections then link live data from your assets to those streams.
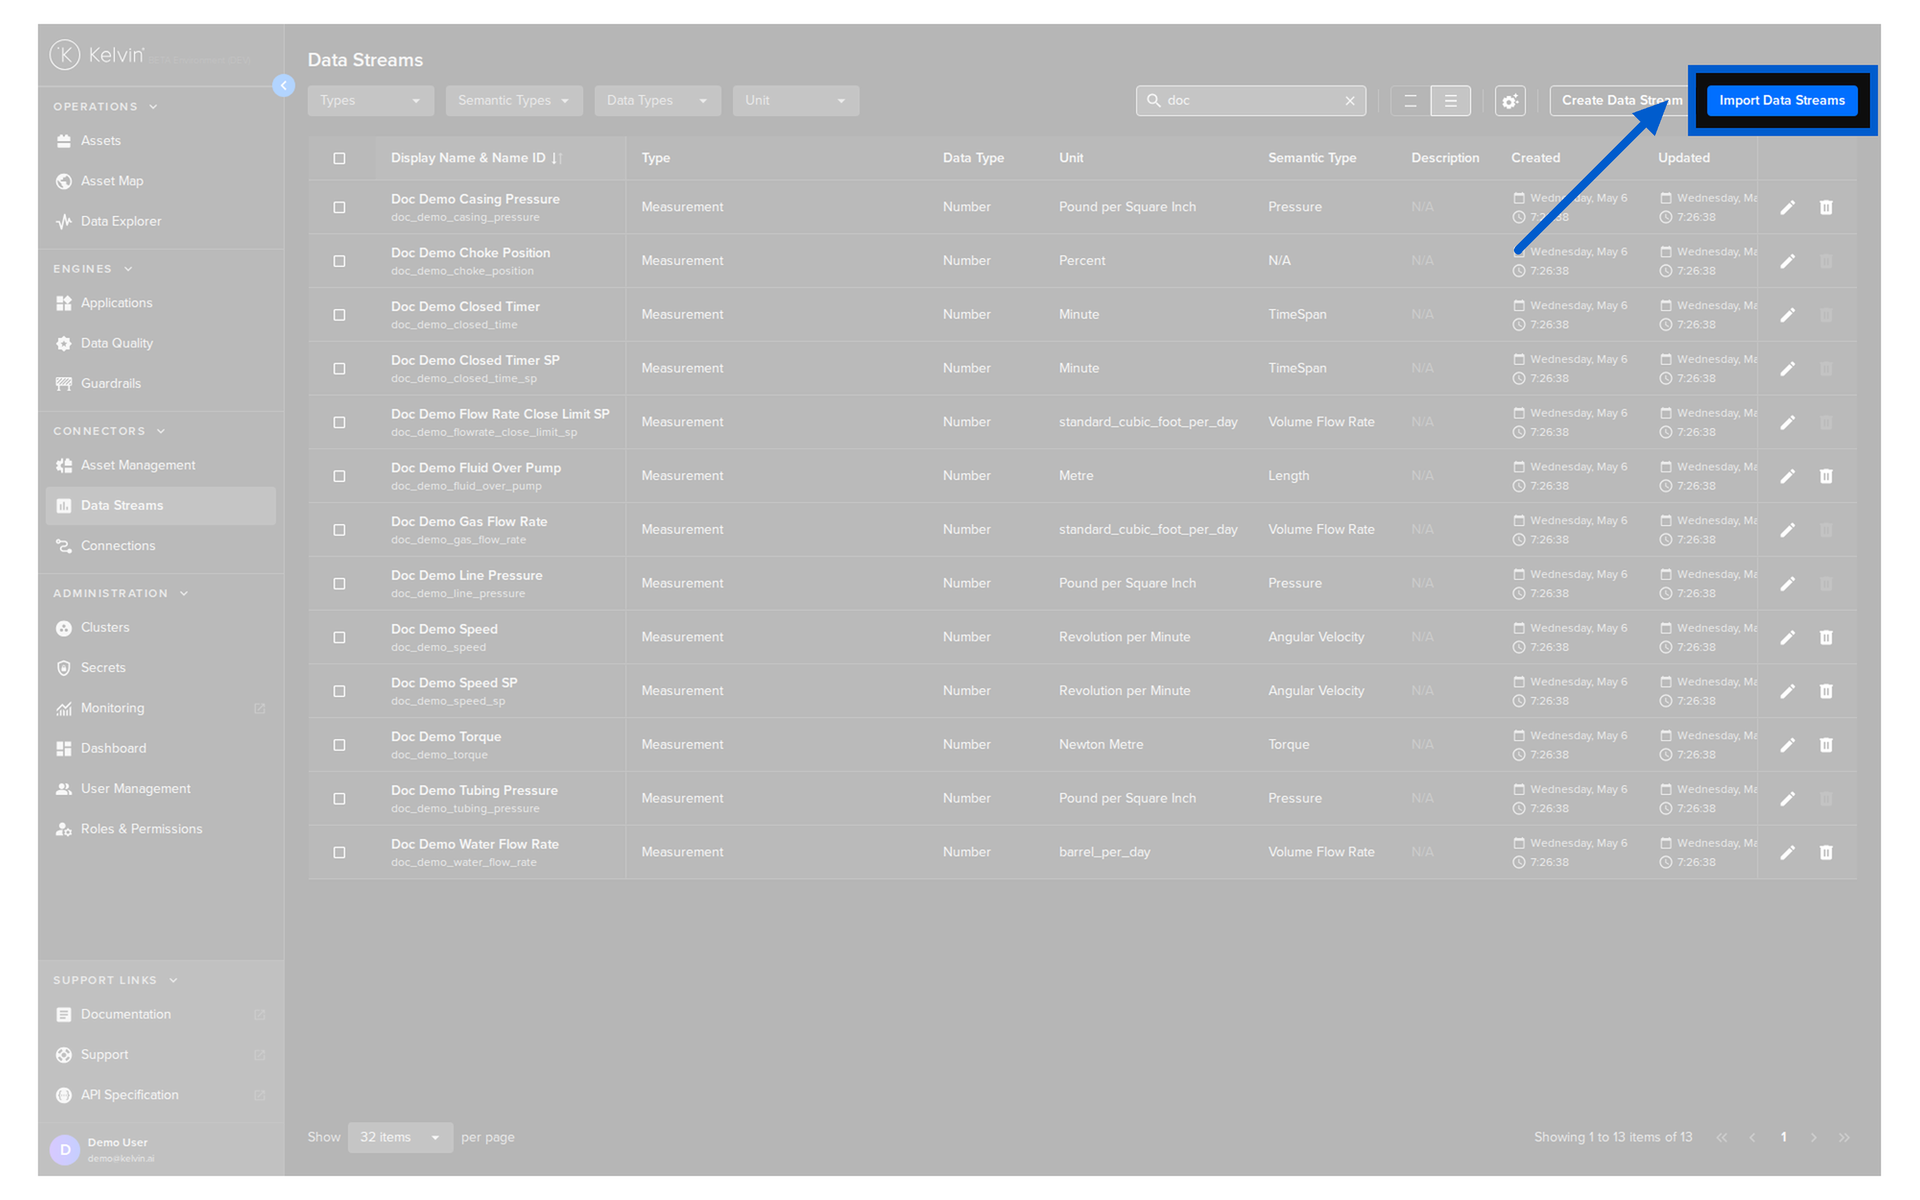
Four stream types
| Type | What it represents |
|---|---|
| Measurement | A value read from an asset — for example, tubing pressure |
| Set Point | A value written to an asset — for example, pump speed setpoint |
| Computed | A value calculated by a SmartApp — for example, an efficiency score |
| Data Quality | A quality score generated by the data quality monitoring system |
Semantic types and units
When you create a data stream, you can (and should) assign a Semantic Type and a Unit.
Note
Even though these are related to Kelvin UI features such as creating Data Streams, these also only manageable throught the Kelvin API.
A Semantic Type gives the stream meaning beyond its raw format. Kelvin includes over 40 built-in semantic types: pressure, temperature, velocity, voltage, and many more. Developers can also define custom semantic types.
A Unit defines the engineering unit for the value: bar, celsius, rpm, volt, and many more. Units can also be created on the fly during stream creation if the unit you need does not exist yet.
This metadata is used by SmartApps to understand what they are working with, and by Operations Engineers to see correctly labelled values in the UI.
Pro Tip
For large rollouts, bulk import data streams via CSV rather than creating them one by one. Define your semantics and units first so your CSV rows are valid from the start. See course 272 for the full bulk import workflow.
For full documentation, visit:
Section 4: Data Quality
Once data is flowing from your assets, how do you know if it is actually good? That is what the Data Quality section answers.
Kelvin runs continuous quality checks on your incoming data and scores each asset/stream pair every 5 minutes.
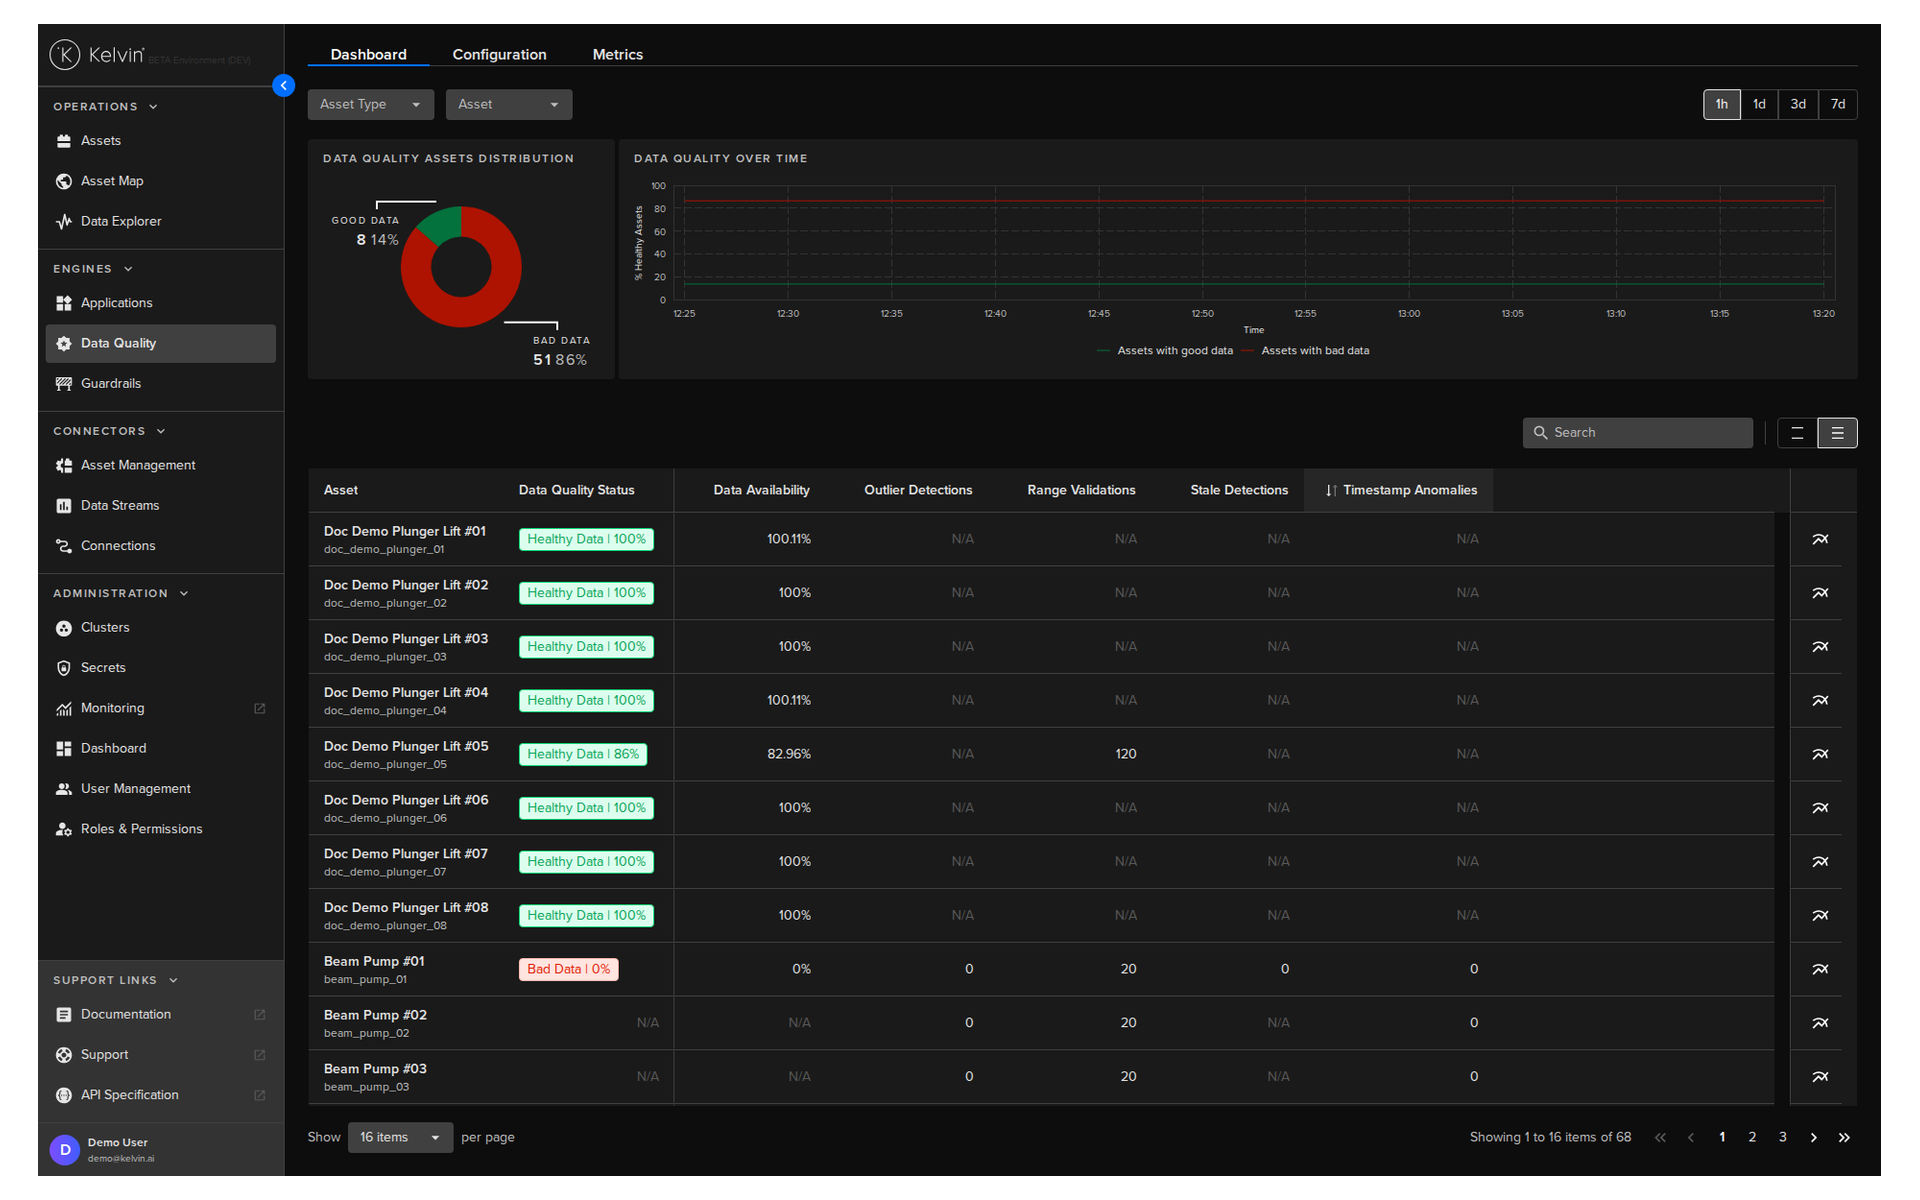
The Data Quality Dashboard
The dashboard gives you an immediate visual read on the health of your data across the platform.
- The top of the dashboard shows platform-wide statistics: the percentage of good vs bad data over time
- The asset list below shows individual per-asset scores with a column for each metric
You can filter by Asset Type, individual Asset, and time window (1 hour to 7 days).
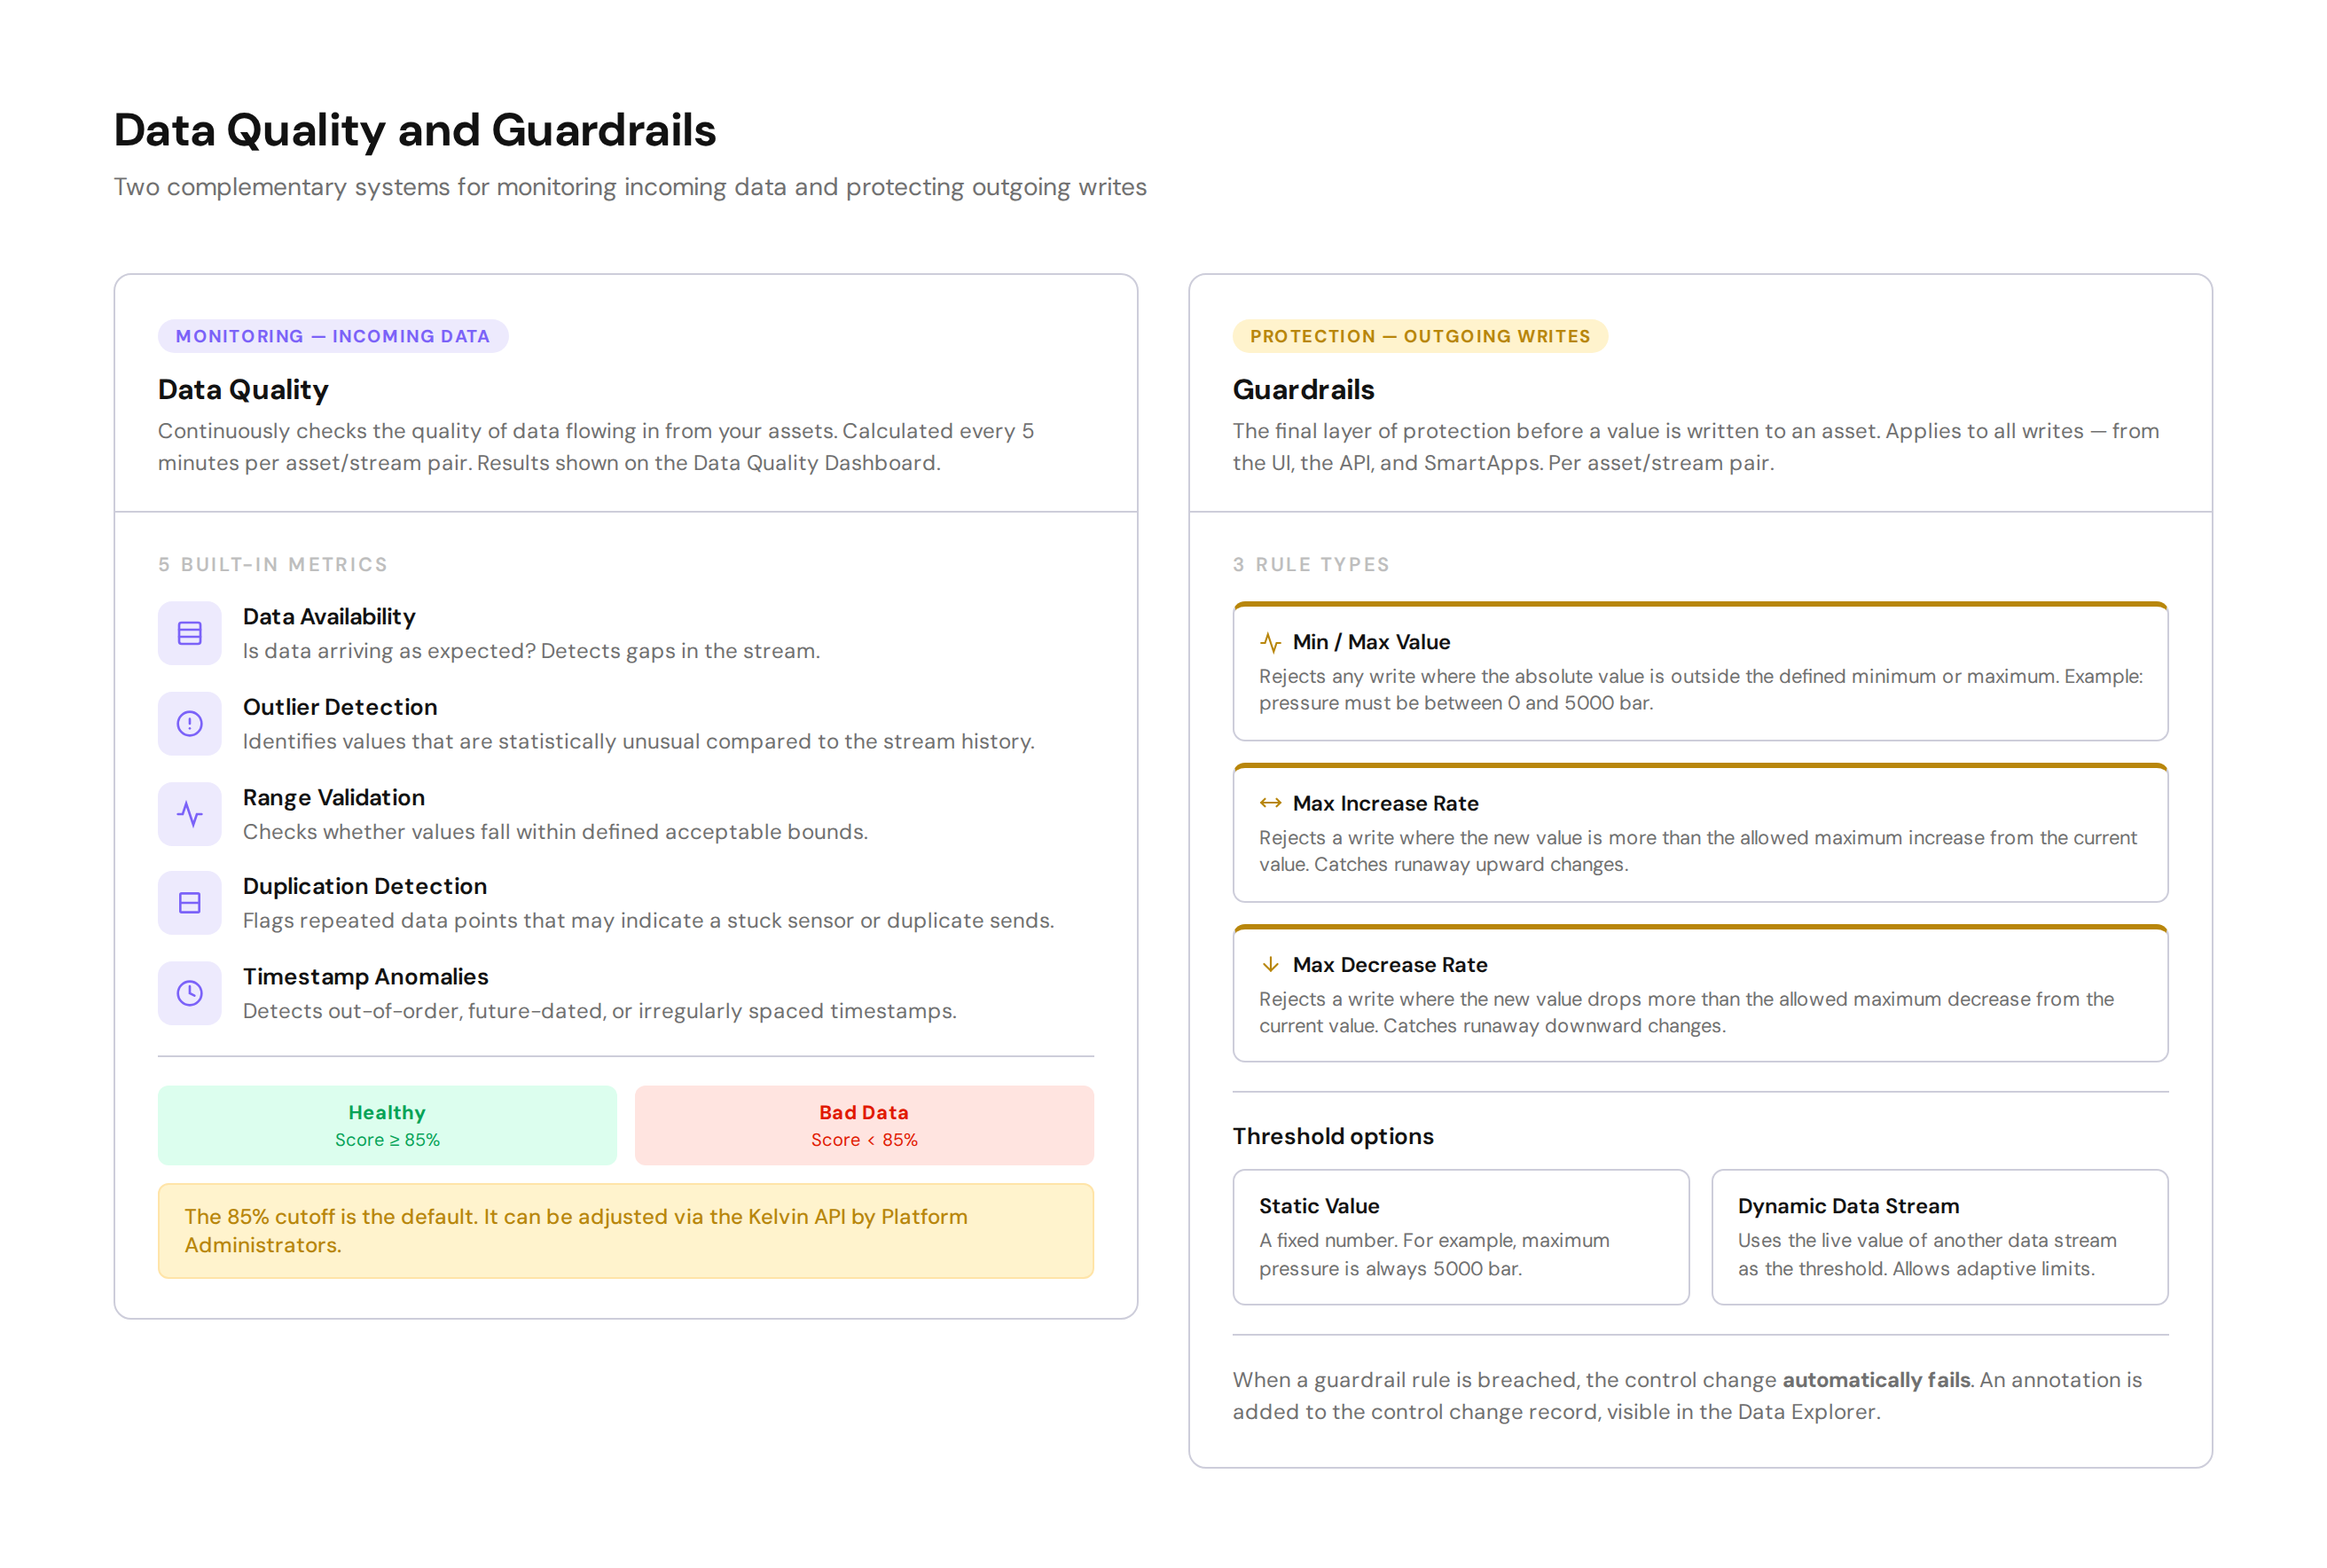
The five built-in metrics
| Metric | What it checks |
|---|---|
| Data Availability | Whether data is arriving at the expected frequency |
| Outlier Detection | Whether values are statistically unusual |
| Range Validation | Whether values are within acceptable bounds |
| Duplication Detection | Whether the same value is being received repeatedly |
| Timestamp Anomalies | Whether timestamps are ordered, realistic, and regular |
Each metric is enabled or disabled per asset/stream pair. If a metric is not enabled for a pair, the dashboard shows N/A for that cell.
Note
The Data Quality health cutoff is 85% by default. A score above this is flagged as Healthy. Below it is flagged as Bad Data. This threshold can be adjusted via the Kelvin API.
Drilling into a problem
If you spot a bad-data flag on an asset, click the analytics icon next to that asset. You can then select a data stream to see detailed metric results on a timeseries graph. From there, a link takes you directly to the Connection workload logs to help you trace the source of the problem.
For full documentation, visit:
Section 5: Guardrails
Guardrails are the final layer of protection before any value is written to an asset. They apply to all writes — whether the instruction comes from the UI, the API, or a SmartApp.
Think of them as a hard stop that no program or user can bypass.
What guardrails protect against
When a guardrail rule is breached, the control change automatically fails. The original value remains on the asset. An annotation is added to the control change record, which you can see in the Data Explorer.
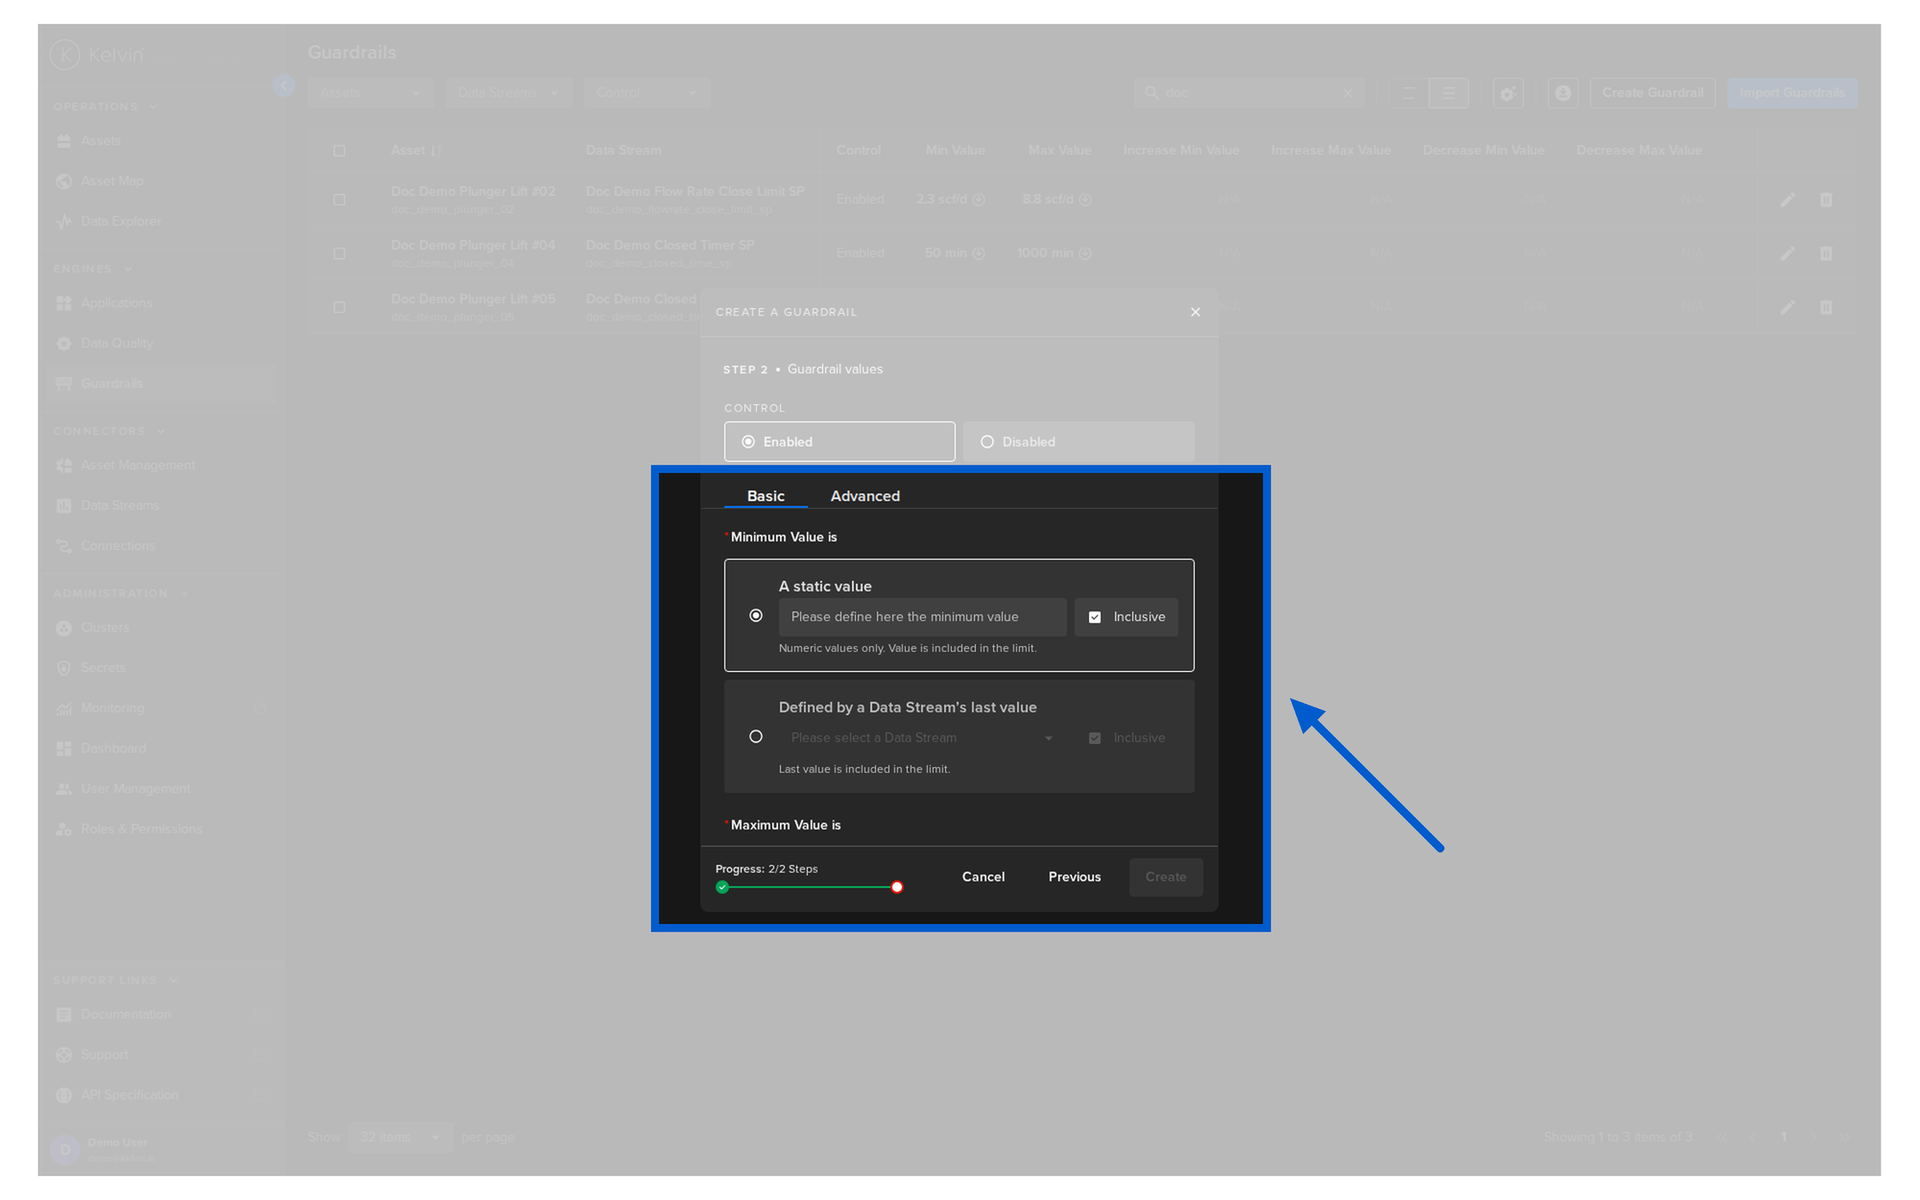
The three rule types
There are three ways to set a guardrail on an asset/stream pair:
| Rule | What it blocks |
|---|---|
| Min/Max Value | Any write where the absolute value falls outside a defined range |
| Max Increase | Any write where the new value rises by more than the allowed amount from the current value |
| Max Decrease | Any write where the new value drops by more than the allowed amount from the current value |
You can combine all three on the same asset/stream pair.
Static vs dynamic thresholds
Each limit can be defined as:
- A static value — a fixed number that never changes
- A dynamic data stream — the live value of another data stream on the platform, allowing limits to adapt to current operating conditions
For full documentation, visit:
Section 6: Cluster Management
This section is where you manage the edge infrastructure you set up in course 271. Once clusters are running, you return here to monitor them and grow them.
What you can do
| Task | Where |
|---|---|
| Register a new cluster | Clusters page > Register Cluster |
| View cluster status and Kelvin version | Clusters list |
| View and manage nodes | Select cluster > Nodes tab |
| Add a worker node | Nodes tab > Add Node |
| Remove a node | Nodes tab > select node > Delete |
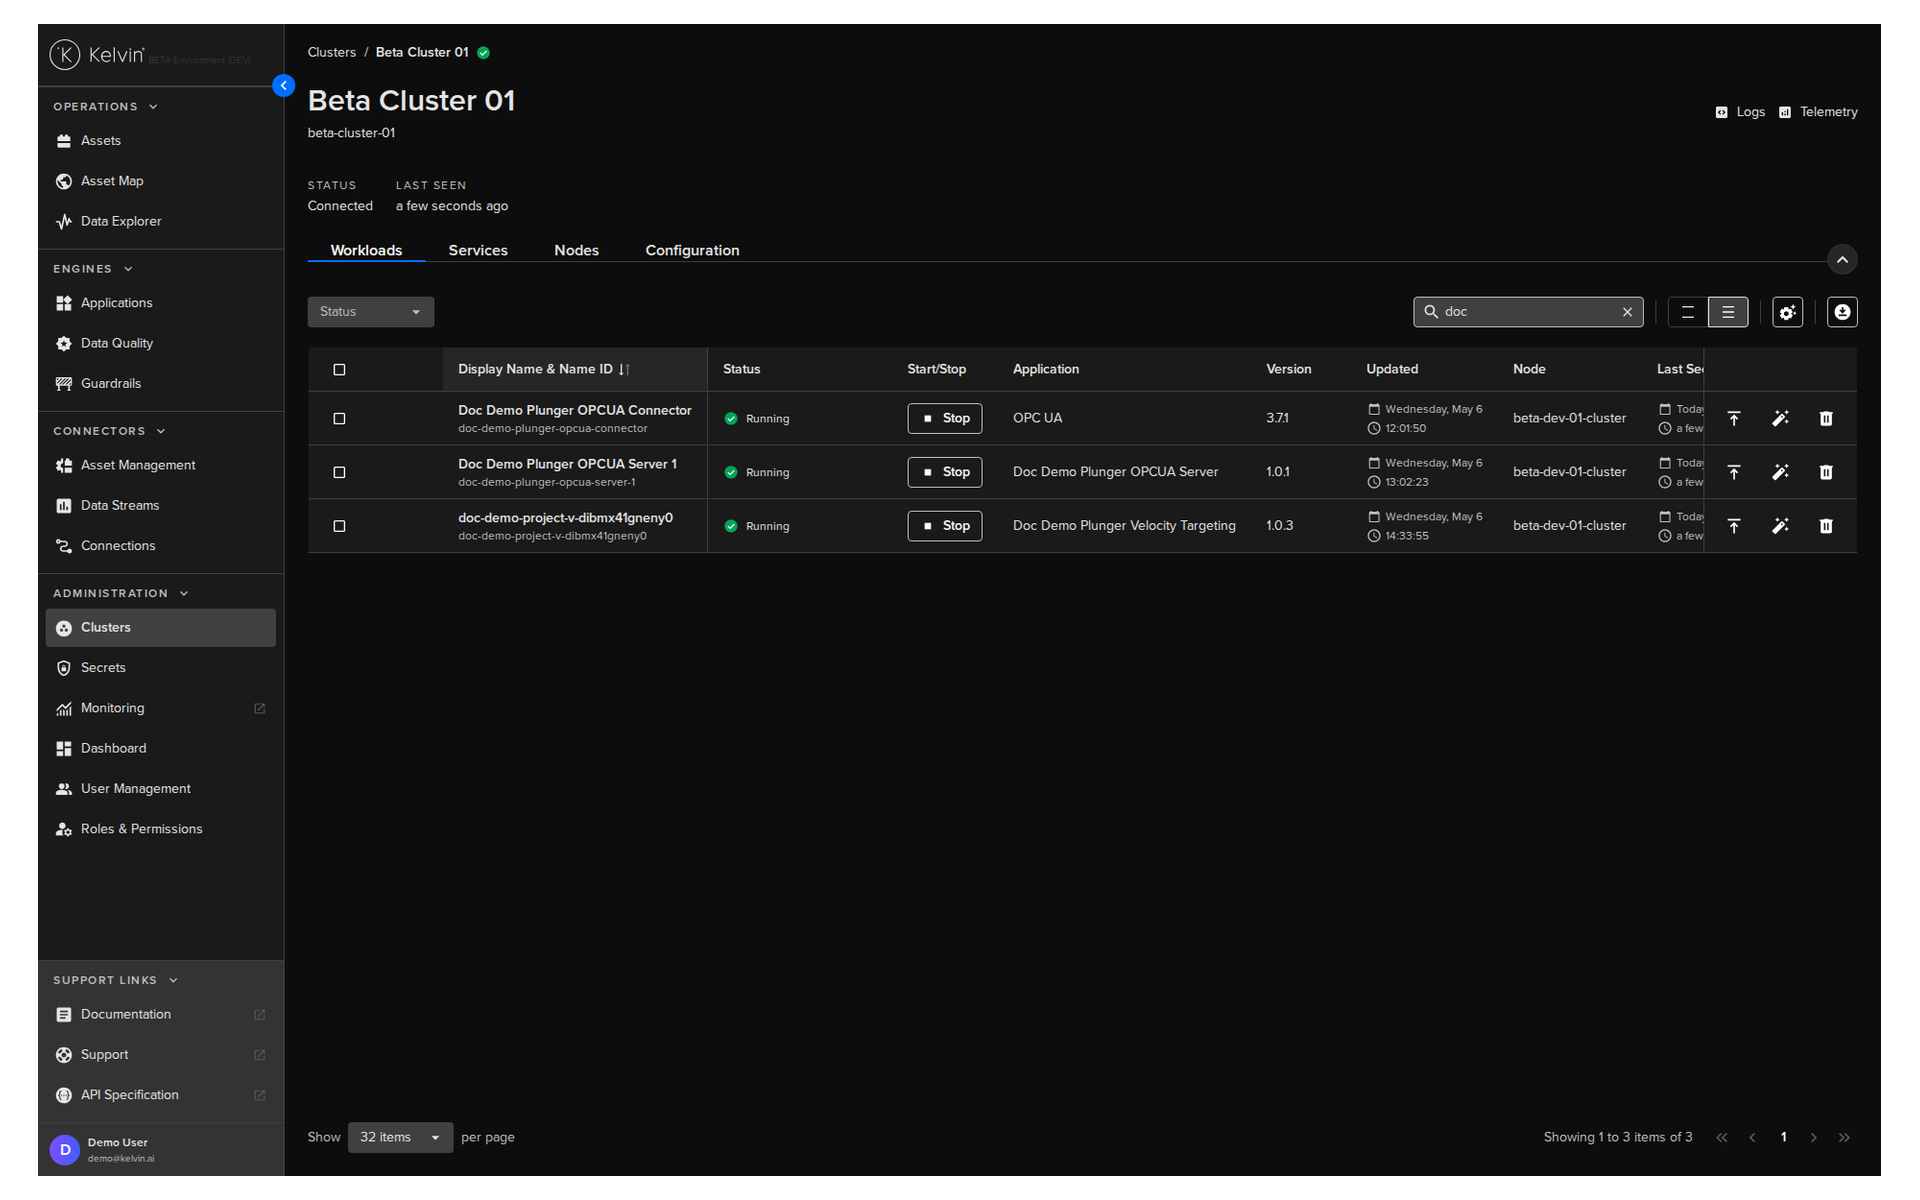
| View workloads running on a cluster | Select cluster > Workloads tab |
| Access the edge local dashboard | Select cluster > Edge Services |
Monitoring cluster health
The cluster view shows you the Kelvin version running on each cluster. This matters when updates are released — you can see at a glance which clusters are current and which need attention.
For full documentation, visit:
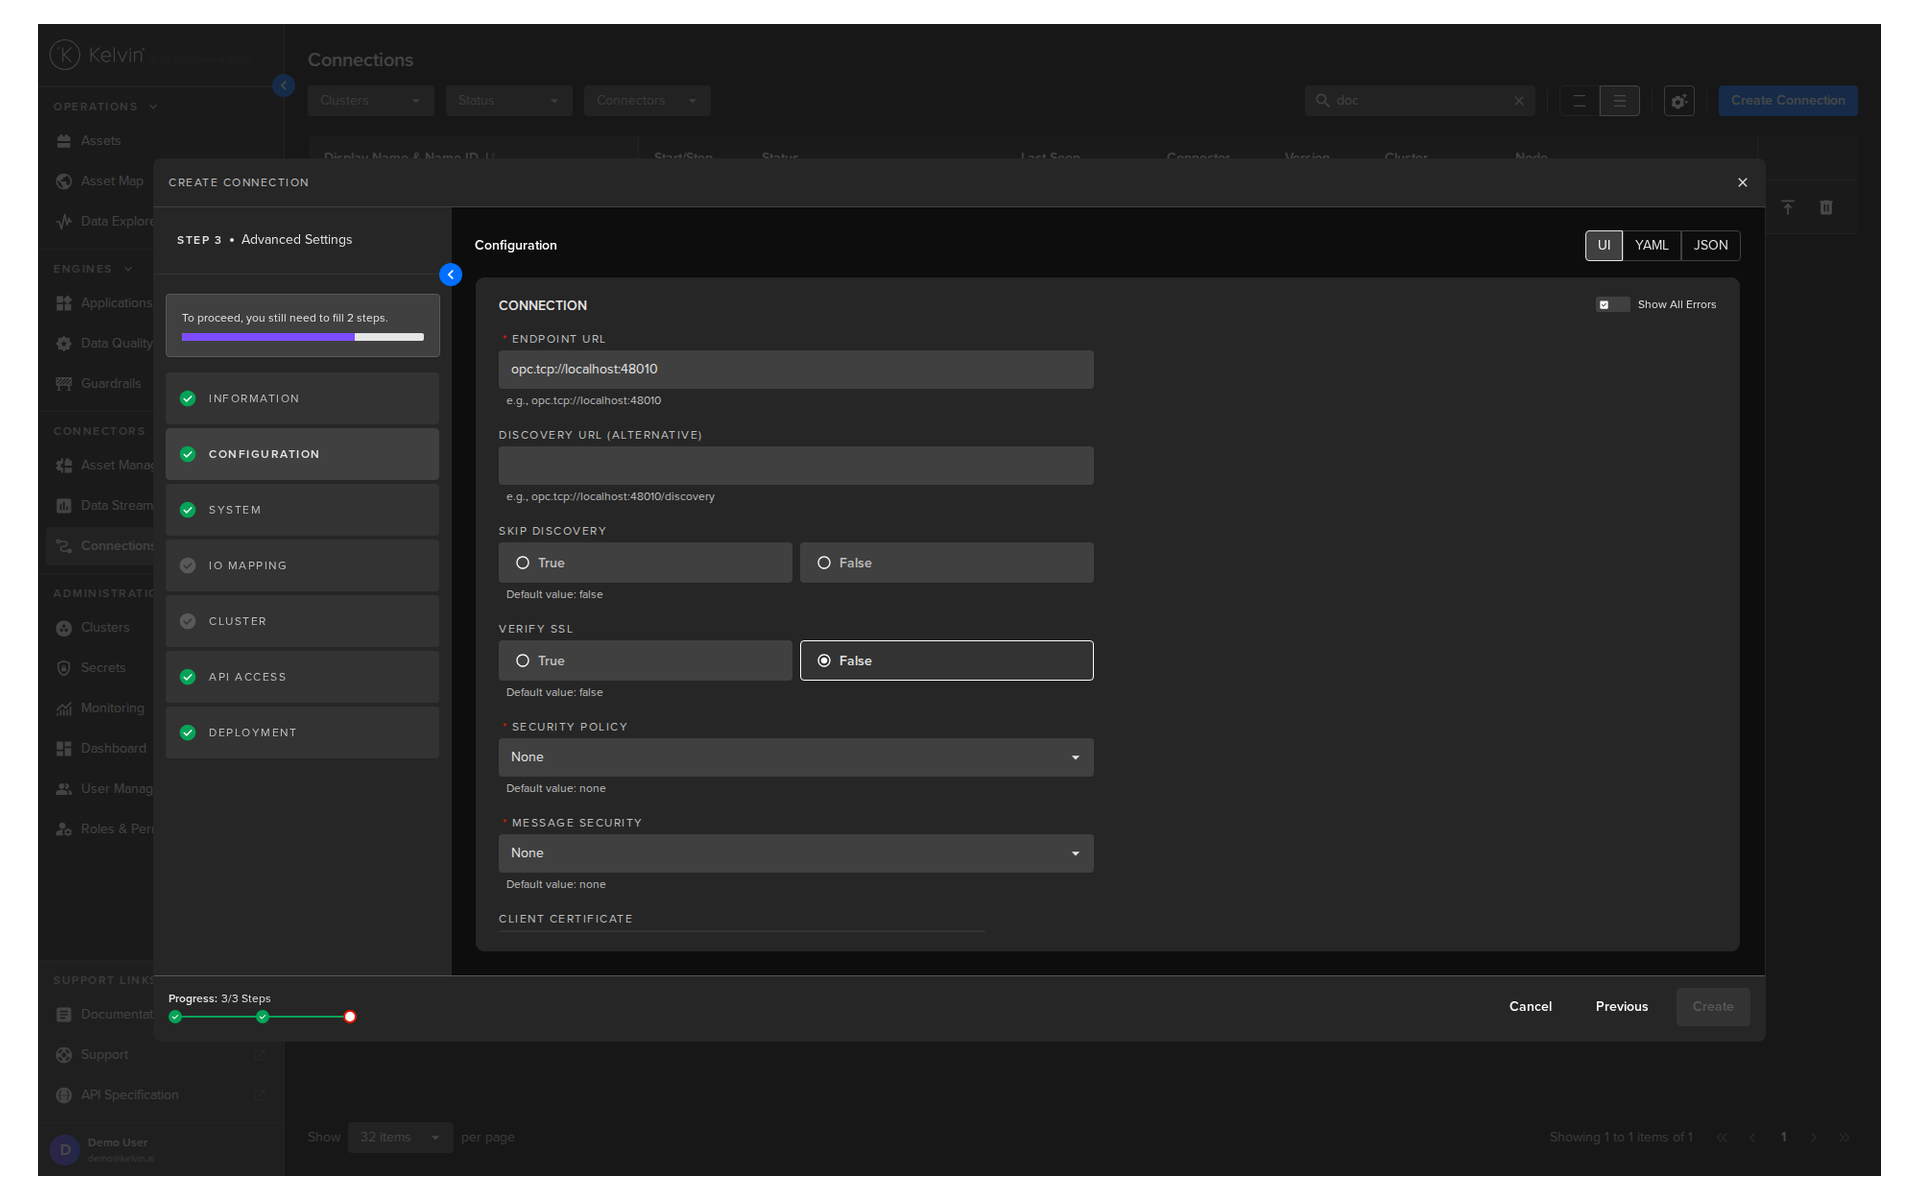
Section 7: Connections
A Connection is a deployed workload on a cluster that collects data from your assets and writes it to Kelvin data streams — or sends instructions back to assets.
Connections are built by Developers and uploaded to the platform. As an Administrator, your job is to deploy them, configure them, and keep them running.
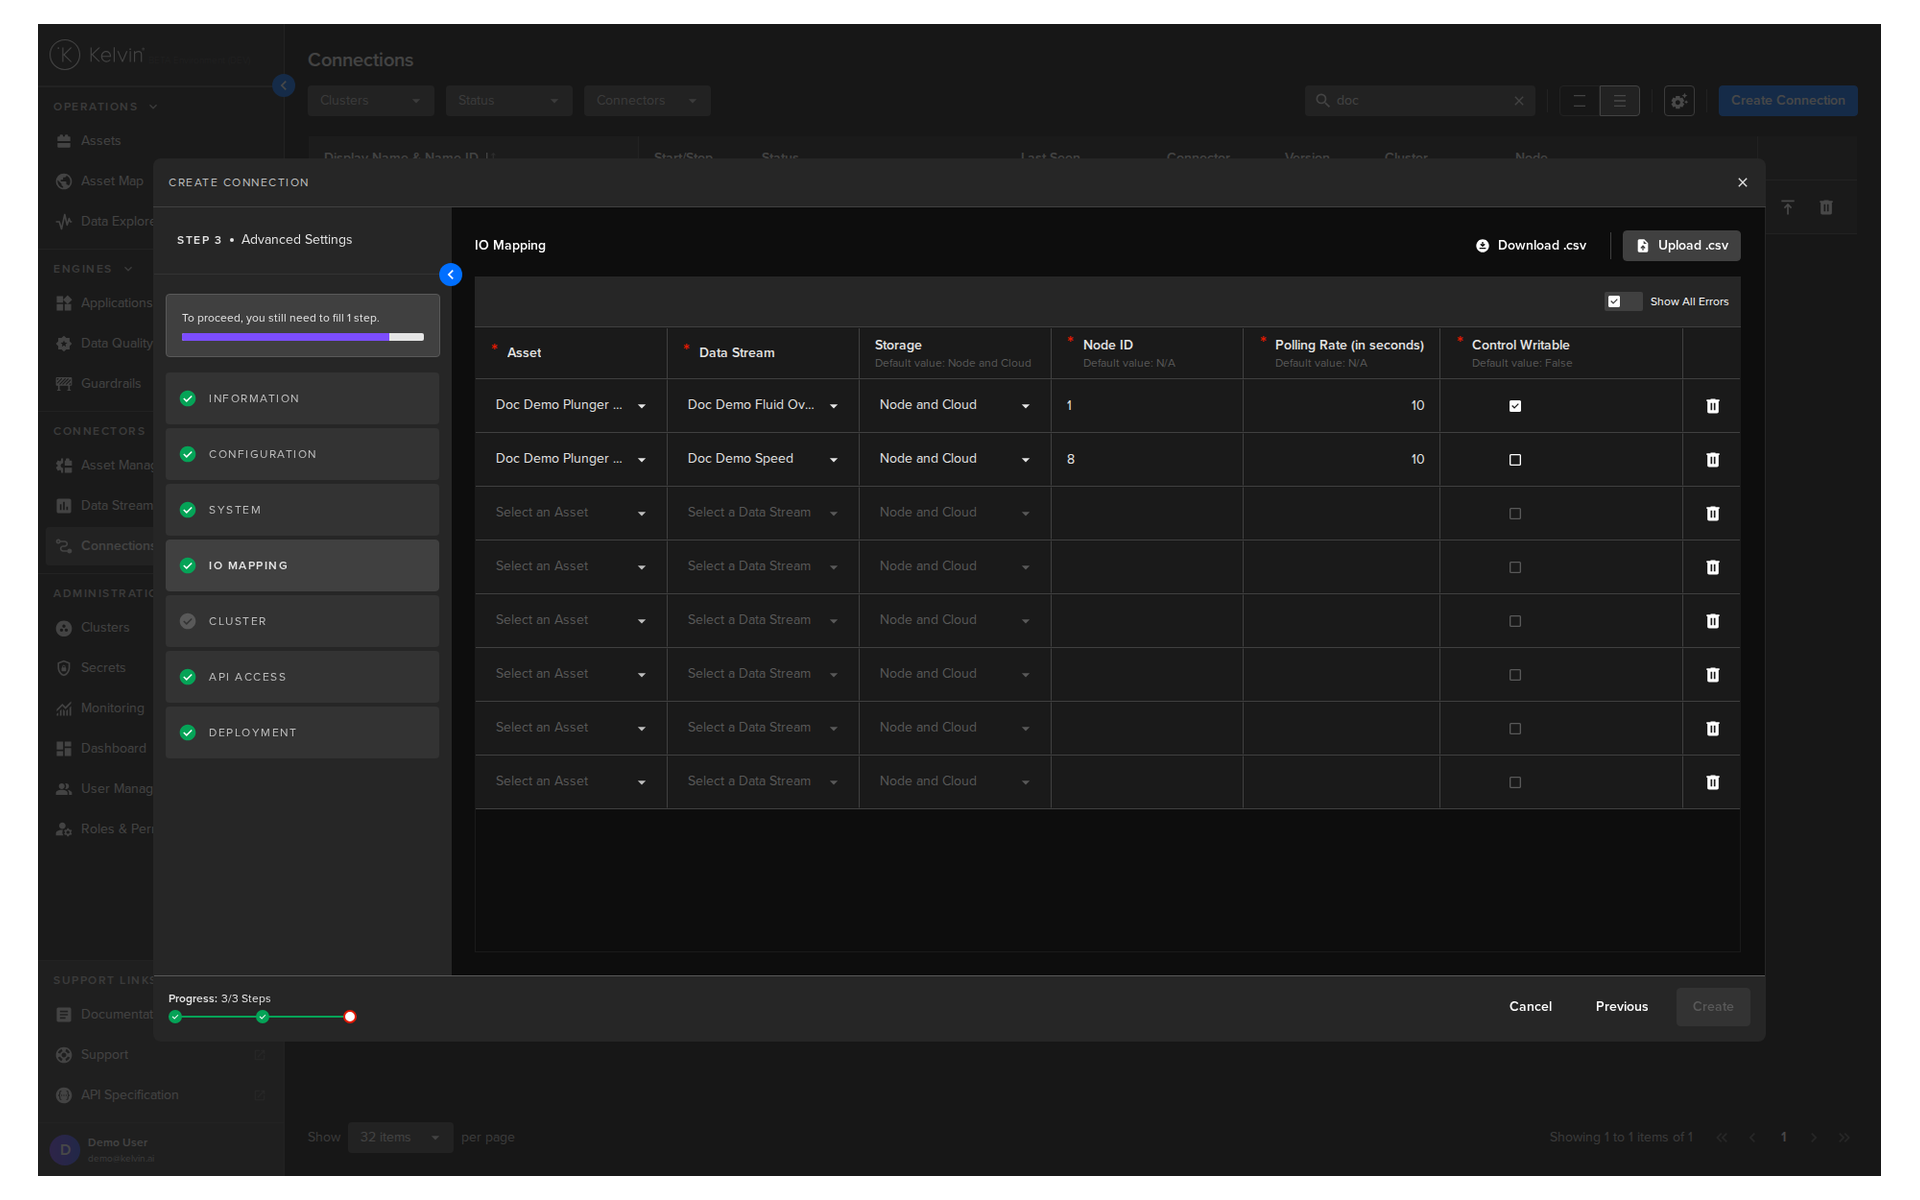
What you manage in Connections
IO Maps are the core of a connection. An IO Map defines which asset is linked to which data stream. When you deploy a connection, you configure its IO map to match your assets.
Key tasks
| Task | How |
|---|---|
| Deploy a new connection | Connections page > create flow |
| Update the connection version | Connection detail > Update Connection |
| Edit the IO map (add/remove assets) | Connection detail > Connection IO tab > Edit IO Map |
| Change configuration settings | Connection detail > Configuration tab > Apply and Redeploy |
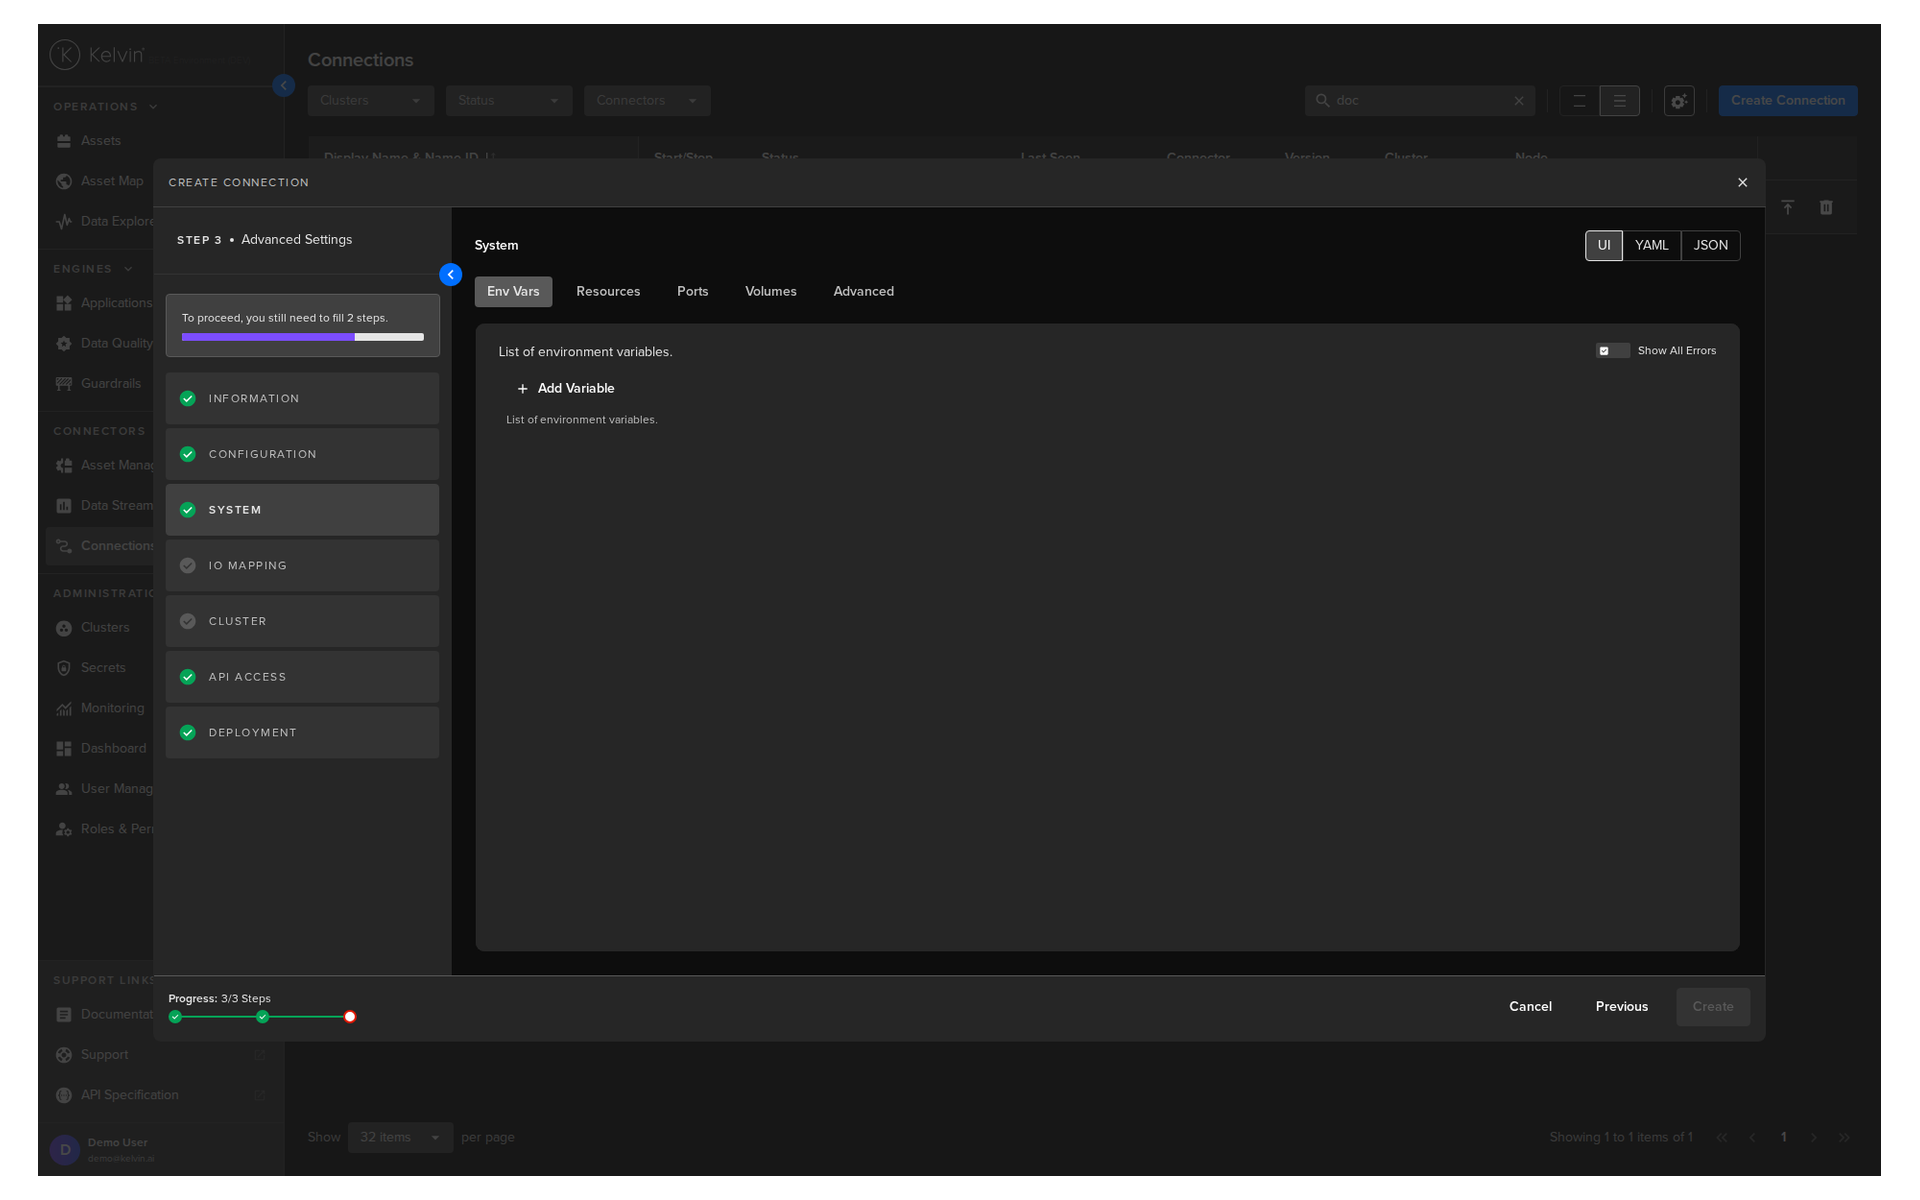
| Change deployment settings | Connection detail > System tab > Redeploy |
| Stop or start a connection | Connection list > toggle running status |
| Delete a connection | Connection list > Delete icon (permanent) |
Warning
Deleting a connection is permanent and cannot be undone. You will need to redeploy a new connection from scratch with all its settings if you need it again.
For full documentation, visit:
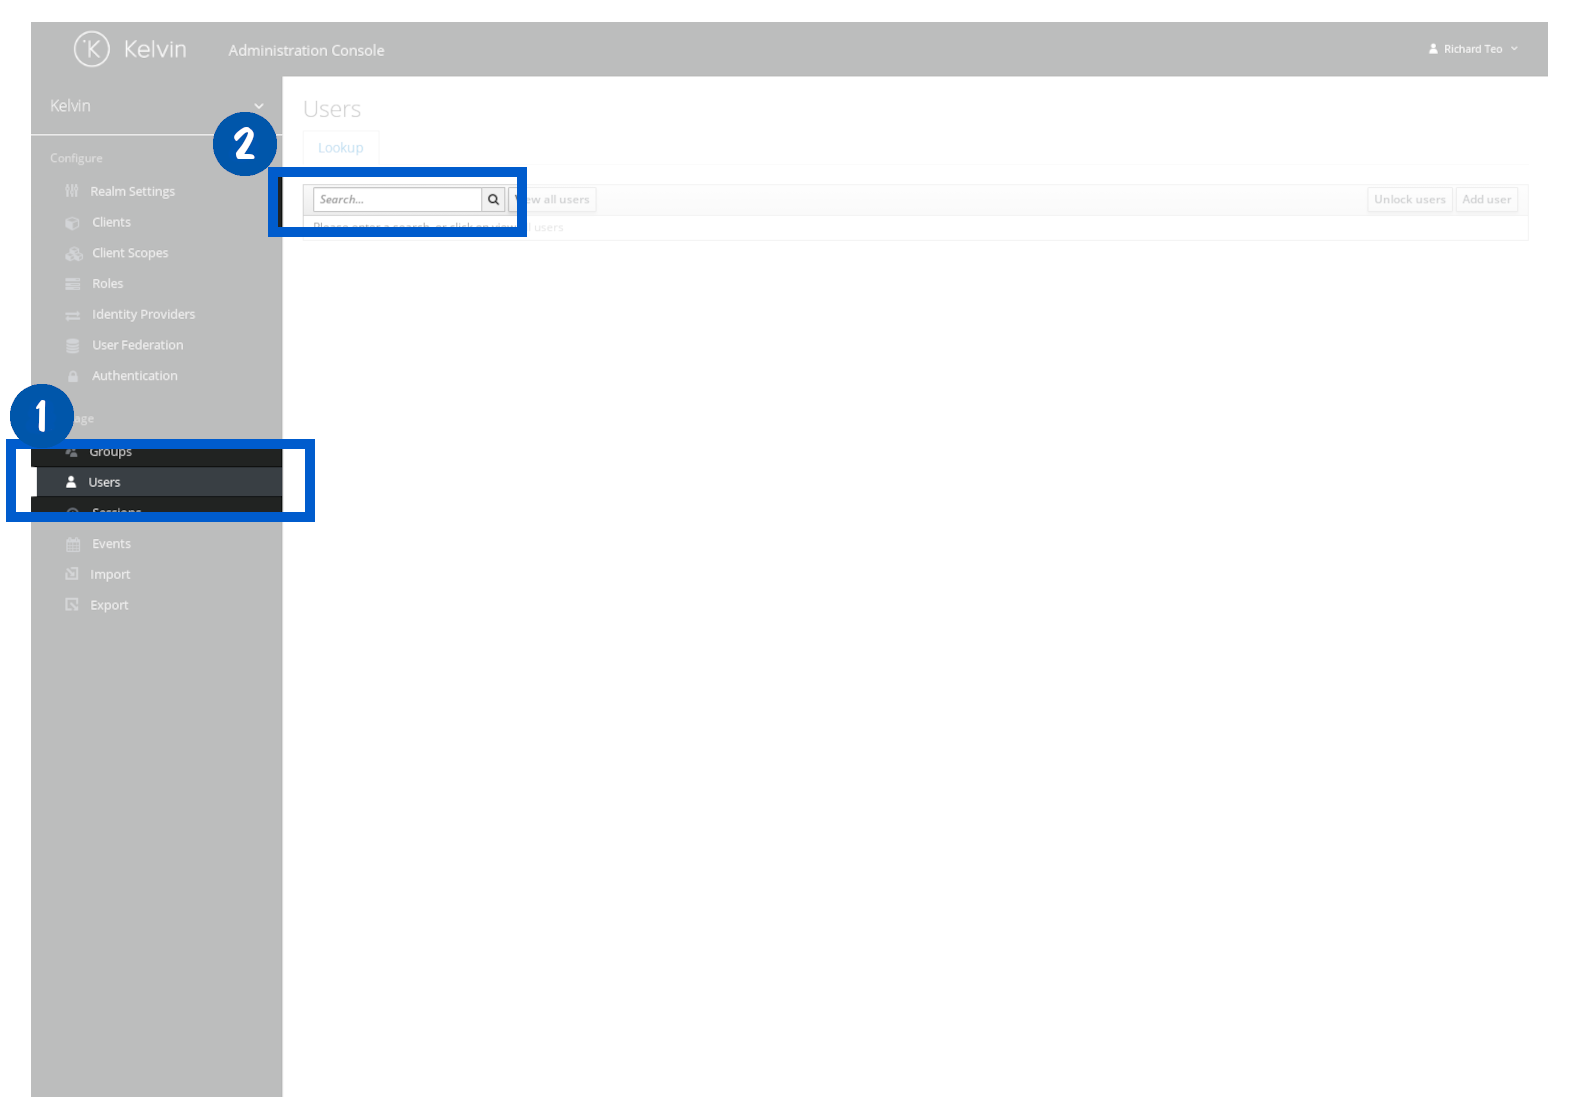
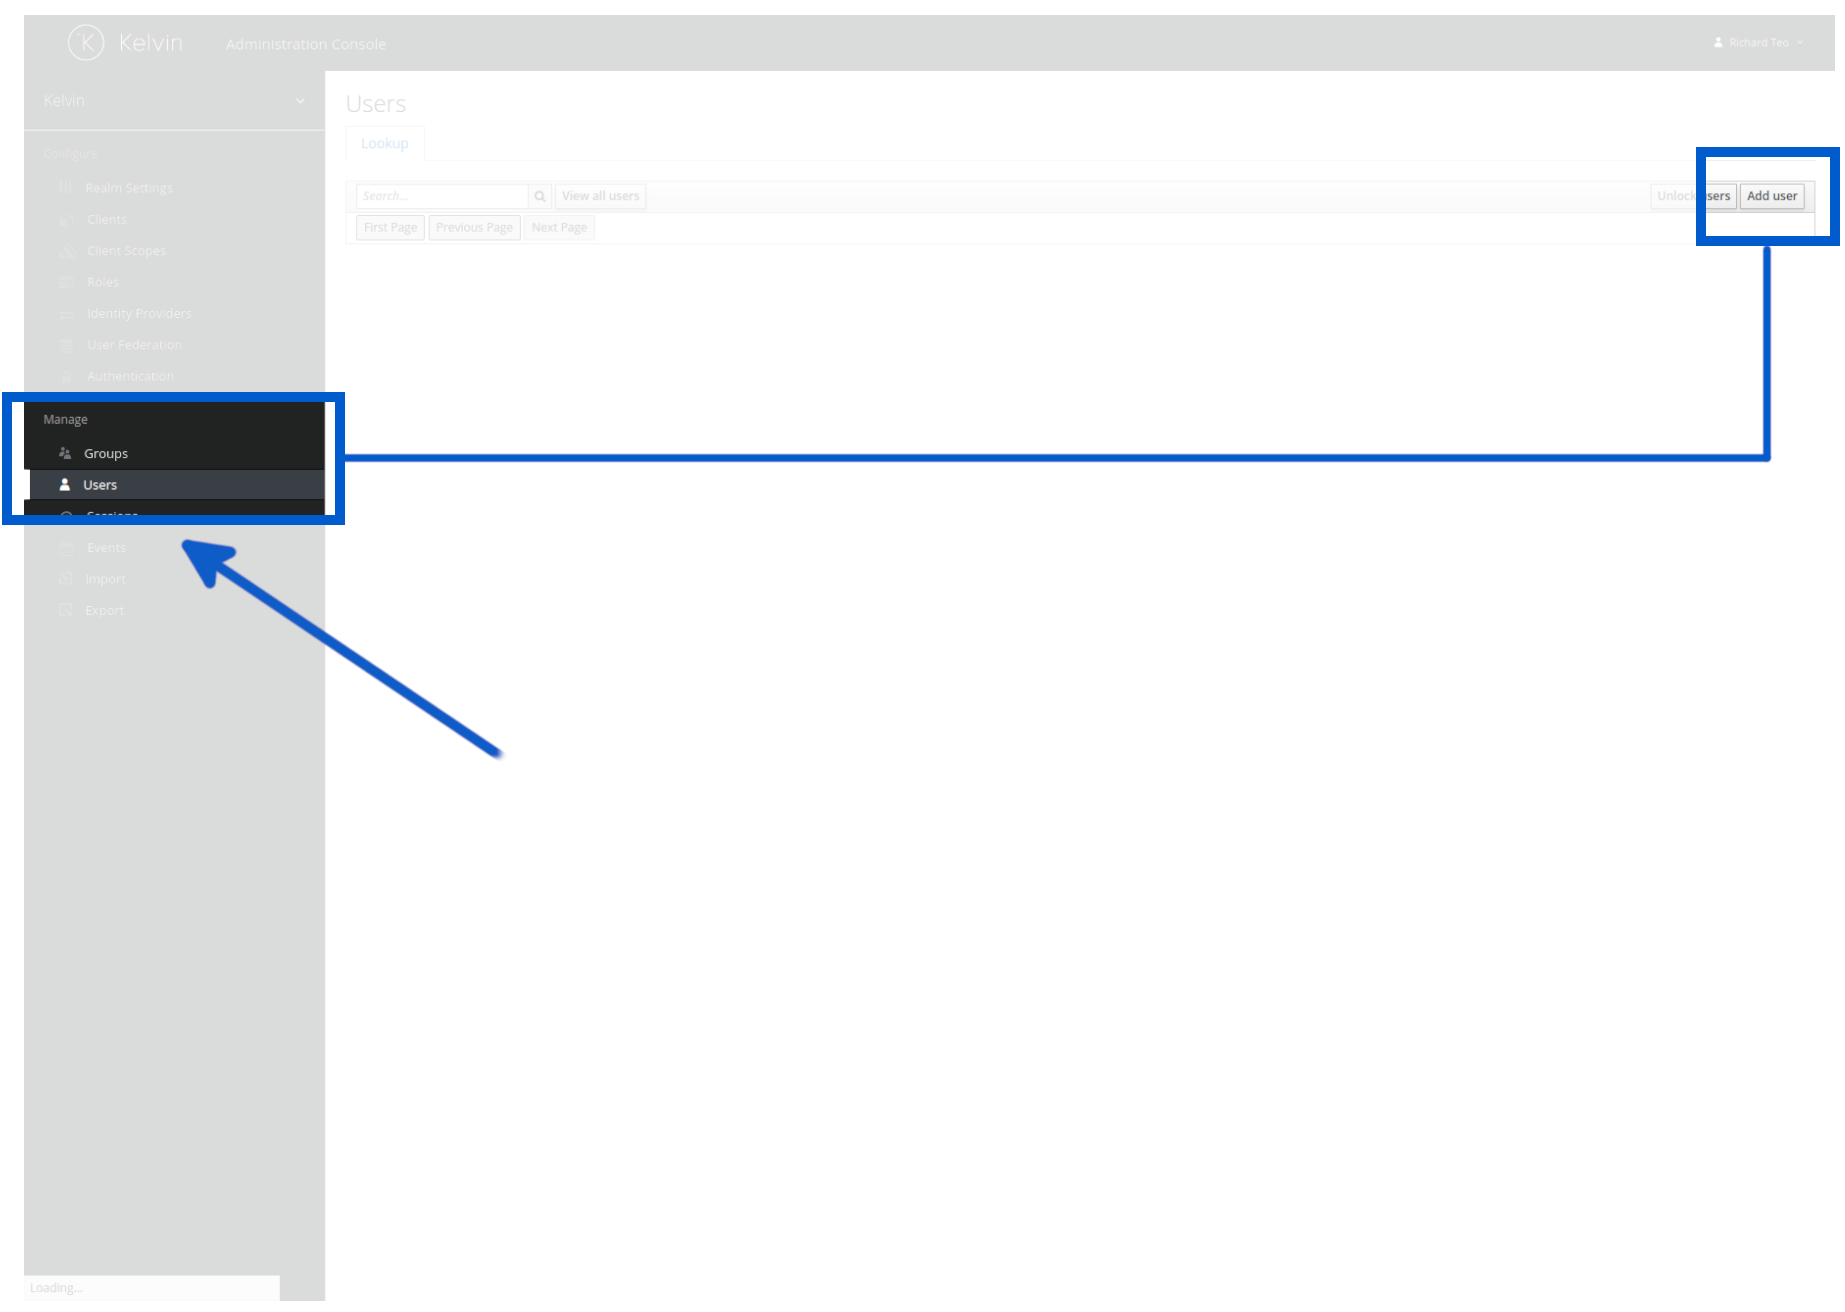
Section 8: User Management
This section is covered in detail in course 271. Here is a summary of everything available to you.
User management in Kelvin controls who can access the Kelvin Platform — not clusters, not SmartApps directly, but the Kelvin UI and API. Once a user is authenticated, their RBAC roles and ABAC policies determine what they can see and do.
What you manage here
Users — Create, edit, and delete individual Platform users. Set temporary passwords, force password changes on first login, and require 2FA.
Groups — Create groups with a standard set of roles. Assign users to groups instead of assigning roles individually. This is the recommended approach for any deployment with more than a handful of users.
Roles and permissions (RBAC) — Assign roles at the group or user level. Roles define what actions (create, read, update, delete) a user can perform on what resource types (assets, data streams, applications, etc.).
Attribute policies (ABAC) — Write YAML-based policies that filter access based on resource attributes. For example, restrict a group to only see assets belonging to a specific asset type.
Note
For the full step-by-step user setup workflow including password policies, 2FA, and ABAC policy examples, see Course 271.
For full documentation, visit:
Section 9: Telemetry and Logs
When things are running, you need to know they are actually working. Kelvin gives you visibility into the health of every workload and connection on the platform through built-in Logs and Telemetry tabs, plus a centralised Grafana dashboard for a platform-wide view.
You can access these tools in two places:
- Directly from the Applications and Connections pages for per-workload or per-connection detail
- From the Monitoring menu in the sidebar for a platform-wide view via Grafana
Workload Status
Before checking logs, start with the workload's current state. Click on Applications, select the SmartApp card, and go to the Workload tab.
Each workload shows one of several states:
| State | What it means |
|---|---|
| Running | The workload is active and processing normally |
| Stopped | The workload has been halted |
| Staged | A new version is waiting to be activated |
If a workload has a staged version waiting, you can expand the row to see its details before activating it.
Workload Logs
From the Workload tab, click on a workload name to open its detail page, then click the Logs tab.
Logs show everything the workload is outputting: errors, warnings, status messages, and any custom output from the SmartApp code.
There are two modes for viewing logs:
| Mode | What it shows |
|---|---|
| Live Data | Logs pulled directly from the edge in real time |
| Forwarded Data | Historical logs synced from the edge to the Kelvin Cloud |
Use Live Data when you have just deployed a workload and want to see what it is doing right now. Use Forwarded Data when you want to review a time range of historical output.
Workload Telemetry
From the same workload detail page, click the Telemetry tab. This shows the compute health of the workload — not what it is doing logically, but how much resource it is consuming.
Metrics available:
- Memory Usage (Requests and Limits)
- CPU Usage (Requests and Limits)
- Network Usage (Received and Transmitted)
- Storage IO
- IOPS and Throughput
Use telemetry to spot workloads that are running out of memory, consuming too much CPU, or generating unexpected network traffic.
Connection Logs and Telemetry
Connections have the same Logs and Telemetry tabs available. Click on Connections, select a connection, and navigate to either tab.
The same Live/Forwarded Data toggle applies to connection logs. Telemetry metrics are identical to those for workloads.
Pro Tip
When Data Quality flags a bad data issue on an asset, the connection logs are the fastest place to trace the root cause. The Data Quality dashboard includes a direct link to the relevant connection's logs.
Grafana Dashboards (Platform-Wide View)
For a platform-wide view across all clusters, nodes, workloads, and connections, Kelvin provides a centralised Grafana dashboard.
Access it by clicking Monitoring in the left sidebar.
Grafana connects to four data sources:
| Data Source | What it contains |
|---|---|
| OpenSearch | Log data for clusters, nodes, and workloads |
| Thanos | Telemetry data for clusters, nodes, and workloads |
| InfluxDB | Data stream values, control changes, and recommendations |
| PostgreSQL | Structured information about assets, apps, and workloads |
You can use Grafana to build custom dashboards and set up alerts — for example, a notification when any workload restarts or when a node is running low on memory. This is particularly useful for proactive platform management.
For full documentation, visit:
- Monitor Dashboard
- Grafana Dashboards
- View Workload Status
- View Workload Logs
- View Workload Telemetry
- View Connection Logs
- View Connection Telemetry
Quick Reference
| I need to... | Go to |
|---|---|
| Get a platform health overview | Administration > Dashboard |
| Create a new asset type | Administration > Assets > Asset Types tab |
| Bulk import assets | Administration > Assets > Import Assets |
| Create a data stream | Administration > Data Streams > Create Data Stream |
| Check data quality across assets | Administration > Data Quality |
| Set write limits on an asset/stream pair | Administration > Guardrails |
| View all clusters and their status | Administration > Orchestration > Clusters |
| Add a node to a cluster | Clusters > select cluster > Nodes > Add Node |
| Deploy or update a connection | Administration > Connections |
| Add a new Platform user | Administration > User Management (Keycloak) |
| Assign permissions to a group | Keycloak > Groups > Role Mappings |
| Check the status of a running workload | Applications > select app > Workloads tab |
| View live logs for a workload | Applications > select app > Workloads > select workload > Logs tab |
| View telemetry for a workload | Applications > select app > Workloads > select workload > Telemetry tab |
| View logs or telemetry for a connection | Connections > select connection > Logs or Telemetry tab |
| Access Grafana for platform-wide monitoring | Monitoring (left sidebar) |
| Run bulk operations via code | Kelvin API or Kelvin API Client (Python) |
Quick Quiz
Quiz 1: Which section of the Kelvin UI is for Platform Administrators, and which is for Operations Engineers?
Answer: Platform Administrators work in the Administration section. Operations Engineers work in the Operations section. Both are accessible from the left sidebar, but they have separate areas and permissions.
Quiz 2: What must exist before you can create an Asset?
Answer: An Asset Type must exist first. Every Asset references an Asset Type by name, and the type must be created before the Asset can be added.
Quiz 3: What are the four Data Stream types available in Kelvin?
Answer: Measurement (incoming sensor data), Set Point (outgoing control values), Computed (calculated by a SmartApp), and Data Quality (quality scores generated by monitoring).
Quiz 4: What is the default Data Quality health cutoff percentage, and what happens when an asset scores below it?
Answer: The default cutoff is 85%. An asset scoring at or above 85% is considered Healthy. Below 85% it is flagged as Bad Data. The cutoff can be changed via the Kelvin API.
Quiz 5: What is the difference between Data Quality and Guardrails?
Answer: Data Quality monitors the quality of data coming in from your assets — it detects problems like gaps, outliers, duplicates, and timestamp issues. Guardrails protect the data going out to your assets — they block writes that would exceed defined value or rate-of-change limits.
Quiz 6: In Connection management, what is an IO Map?
Answer: An IO Map defines the mapping between assets and data streams within a Connection. It specifies which asset is linked to which stream, so the Connection knows where to read data from and where to write it.
Quiz 7: Why is creating Groups recommended before creating individual users in Kelvin?
Answer: Groups hold a standard set of roles. Assigning a user to a group applies all those roles at once, which is far faster than assigning roles to each user individually. It also makes future updates easier — changing a group's roles updates all users in that group at once.
Quiz 8: What is the difference between Live Data and Forwarded Data in workload and connection logs?
Answer: Live Data pulls logs directly from the edge in real time — ideal when you have just deployed a workload or connection and want to see immediate output. Forwarded Data pulls historical logs that have been synced from the edge to the Kelvin Cloud, which is better for reviewing a time range of past activity.
Summary
You now have a complete map of the Administration area in the Kelvin UI. Every section has a clear purpose, and they build on each other.
The key things to remember:
- The Dashboard gives you a platform-wide health view with filters — use it regularly
- Asset Management follows a strict hierarchy: Asset Type first, then Assets, then Properties
- Data Streams carry the signals; semantic types and units give those signals meaning
- Data Quality monitors incoming data continuously; the health score is calculated every 5 minutes
- Guardrails are the last line of defence before any value is written to an asset
- Cluster Management is where you manage your edge infrastructure after initial setup
- Connections are deployed workloads that bridge assets to data streams — you manage their IO maps, config, and lifecycle
- User Management controls Kelvin Platform access through Keycloak groups, RBAC, and ABAC
- Telemetry and Logs give you workload and connection health visibility through per-workload Logs and Telemetry tabs, plus a platform-wide Grafana dashboard
For full documentation, visit:
- Administration Dashboard
- Asset Administration
- Data Stream Administration
- Data Quality Dashboard
- Guardrails
- Cluster Management
- Connection Management
- User Management
- Monitor Dashboard
- Grafana Dashboards
Good luck and Happy Learning !