Insights
On this page you will learn about what is an Insight and how it fits into Kelvin.
What is an Insight?
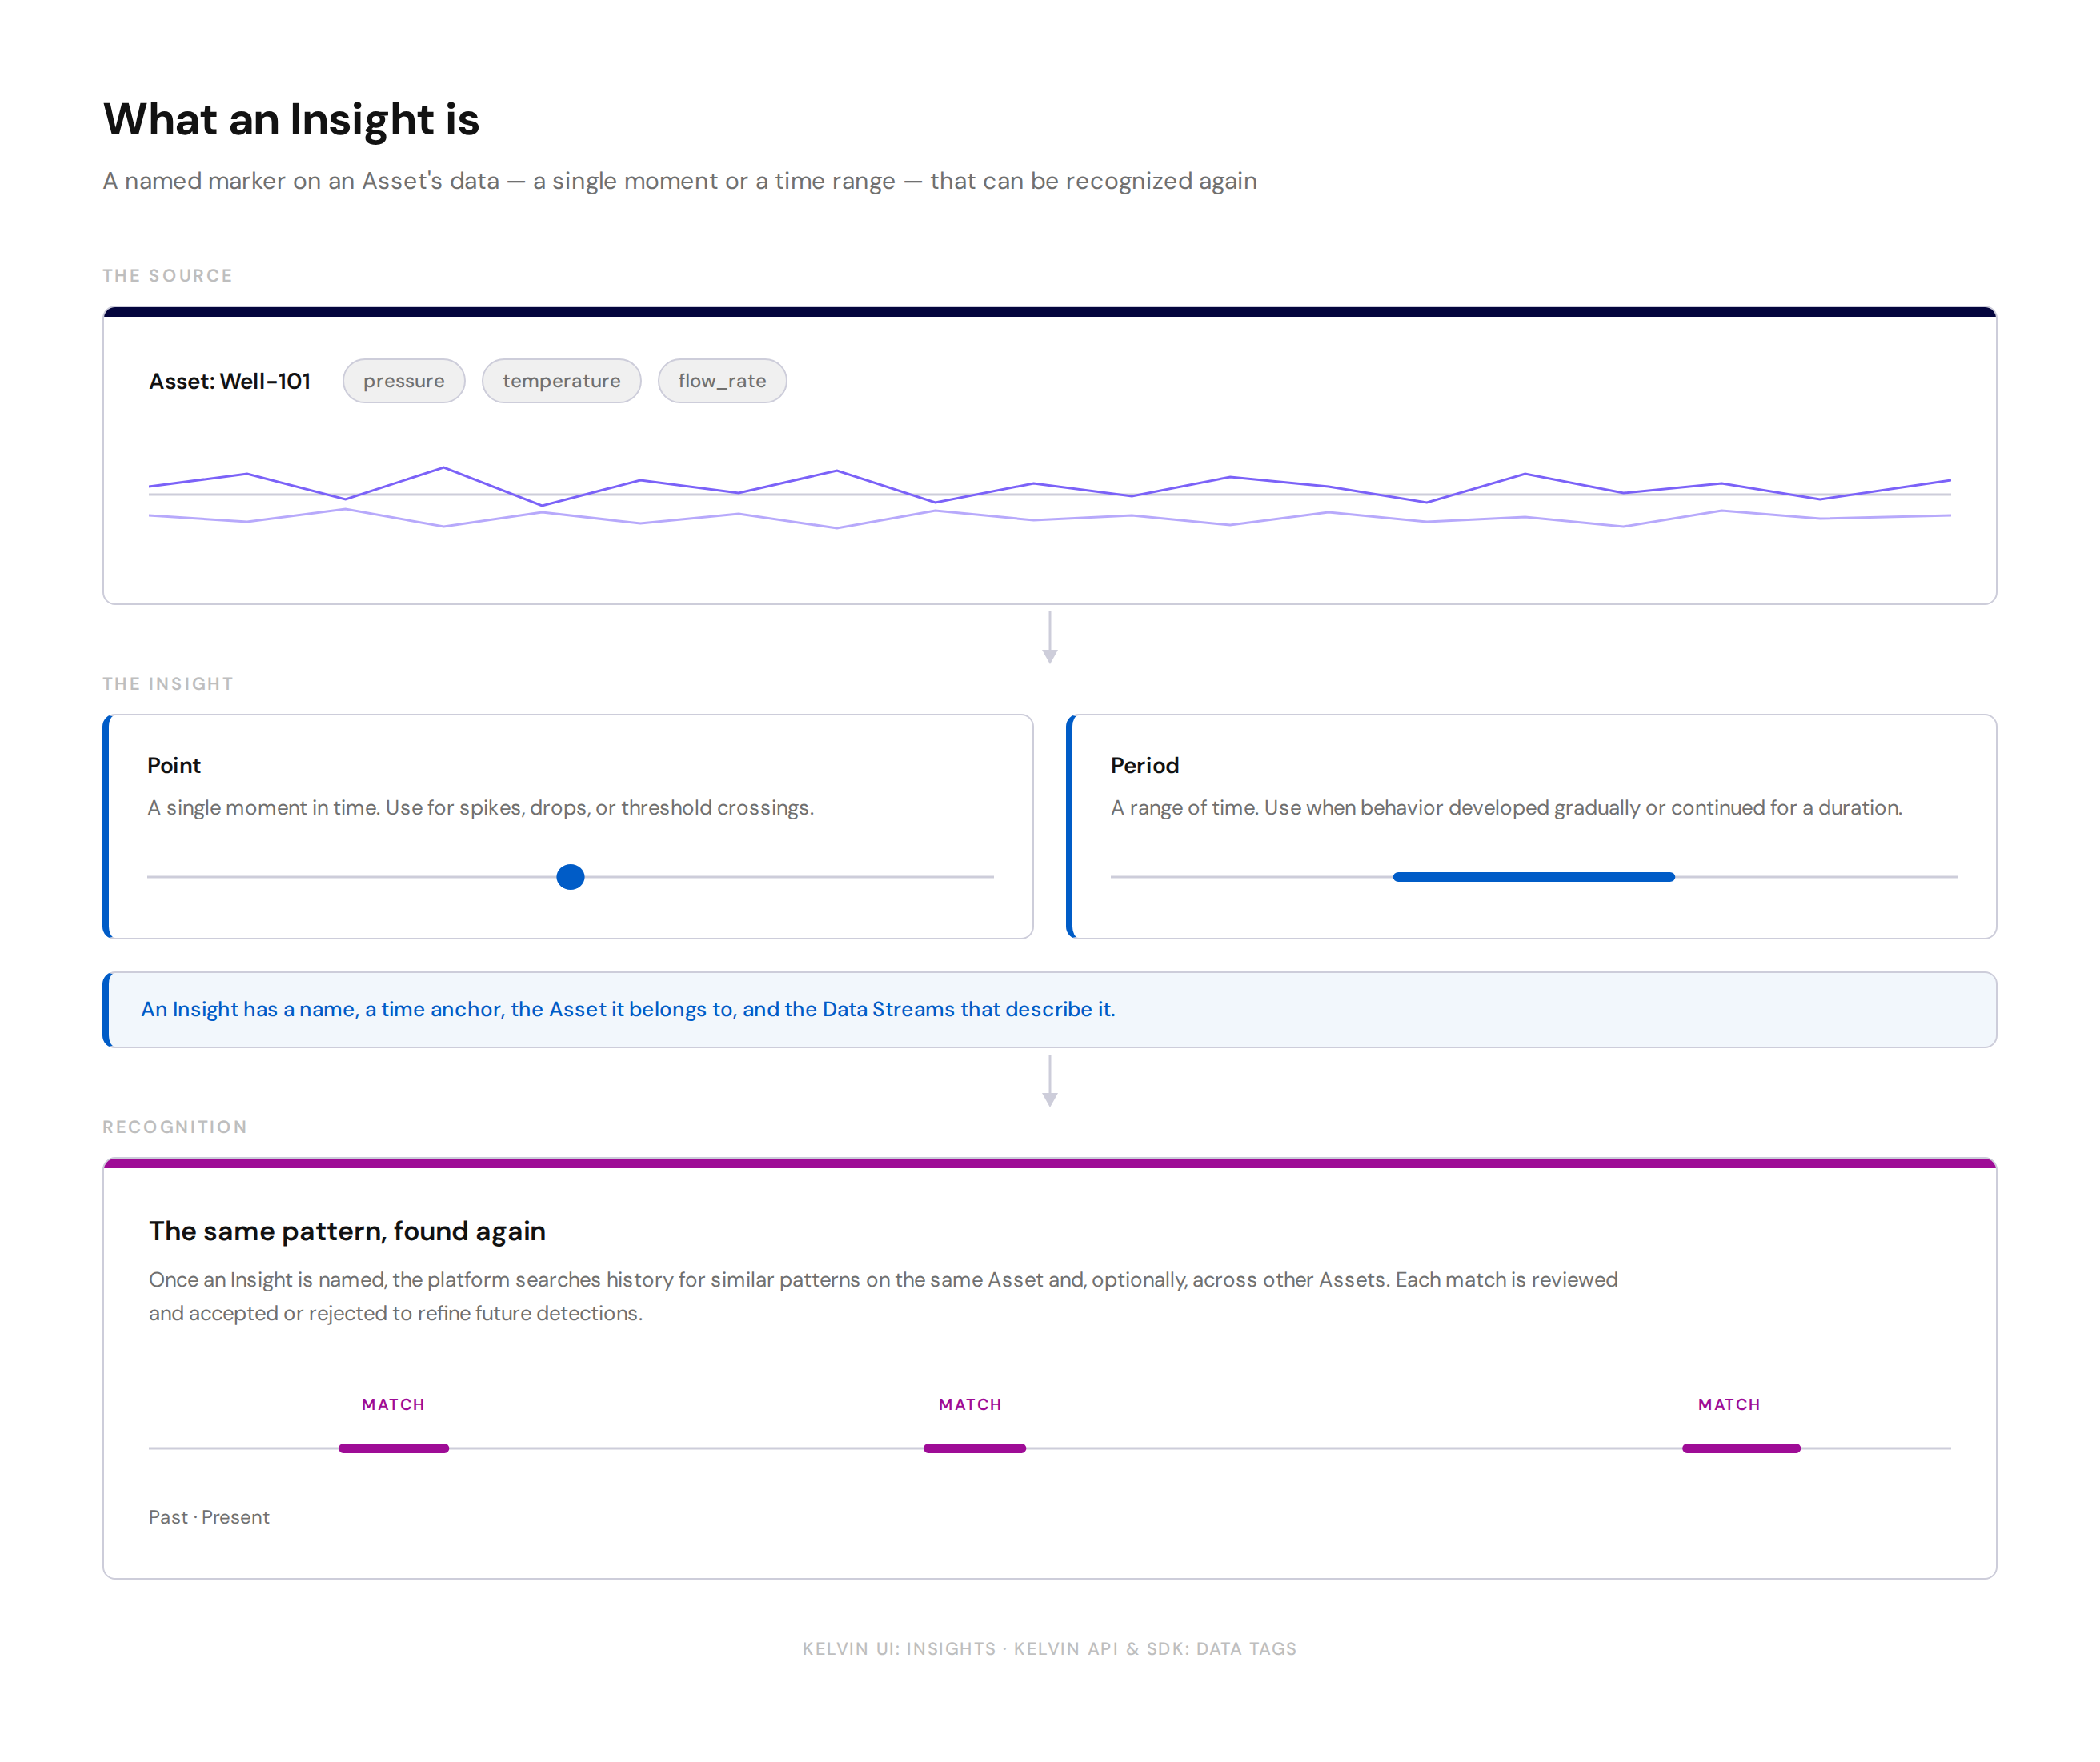
An Insight is a record placed against an Asset that captures something meaningful in its operational history. An Insight marks either a single moment in time or a continuous period, gives it a name, and links it to the Data Streams that describe the behavior.
Insights give Operations Engineers, Developers, and Platform Administrators a shared way to record what has happened on an Asset and to recognize when the same thing happens again.
Why Insights exist
Industrial operations produce continuous streams of data. Important moments — a pressure spike, a slow drift, a successful intervention, an unusual shutdown — often pass without being recorded in a way that others can find later.
Insights address this by attaching a name and context to those moments. Once a moment is named, it stops being an isolated observation and becomes part of the Asset's operational record.
Point or Period
Every Insight is one of two types:
- Point. The event happened at a single moment, such as a sudden spike, drop, or threshold crossing.
- Period. The event spans a range of time, used when the behavior developed gradually or continued for a duration.
How an Insight is used
Insights are used in two complementary ways:
- To mark a known event. A user opens the Data Explorer, selects a point or a time range, gives it a name, and assigns the relevant Data Streams. The Insight is stored against the Asset and is visible to anyone reviewing that Asset later.
- To recognize recurring patterns. Once an Insight has been named, the platform searches the historical data for similar patterns on the same Asset and, optionally, across other selected Assets. Each match is reviewed and either accepted or rejected, which refines how similar patterns are detected in future.
Where Insights fit
Insights sit between raw operational data and structured automation.
- Raw measurements are recorded as Data Streams against an Asset.
- An Insight names a moment or window in that data and links it to the Data Streams that matter.
- Recurring Insights can then be used as the trigger for a Task, where each detected match drives a repeatable response.
In this way, Insights turn unstructured observation into reusable operational context that the platform and the teams using it can act on.
Who uses Insights
- Operations Engineers create Insights from the Kelvin UI to mark what they observe and to teach the platform which patterns matter.
- Developers and Data Scientists create Insights from code to flag events automatically, and read them back for analysis or model training.
- Platform Administrators manage the catalog of Insight names so the same terminology is used consistently across teams and Assets.
No programming experience is required to create or review an Insight from the Kelvin UI.
Naming
In the Kelvin UI, this concept is named Insights. In the Kelvin API and the Kelvin SDK, the same concept is named Data Tags. Both names refer to the same underlying record.
Reference
| Field | Description |
|---|---|
| Name | The name of the Insight. Users select an existing name from the list or create a new one. |
| Type | Whether the Insight is a Point (single moment) or a Period (time range). |
| Start time | The moment the Insight begins. For a Point, this is the only timestamp. |
| End time | The moment the Insight ends. Used only for a Period. |
| Asset | The Asset the Insight is recorded against. |
| Data Streams | The Data Streams considered relevant to this Insight. |
| Description | Optional free text providing extra context about what the Insight represents. |
| Source | The user or process that created the Insight. |